


Moving averages are the bread and butter of technical analysis—smoothing out price action like a skilled bartender crafting the perfect cocktail. These mathematical marvels filter market noise, reveal trends, and provide traders with crystal-clear signals in an otherwise chaotic financial landscape. Whether you’re scalping forex pairs or swing trading blue-chip stocks, understanding moving averages isn’t just helpful—it’s absolutely essential for your trading arsenal.
Key Takeaways
- Moving averages smooth price data to identify trend direction and potential reversal points with mathematical precision
- Three main types exist: Simple Moving Average (SMA), Exponential Moving Average (EMA), and Weighted Moving Average (WMA), each serving distinct trading purposes
- Crossover strategies using multiple moving averages can generate powerful buy and sell signals for various timeframes
- Support and resistance levels often form around key moving averages, particularly the 50-day and 200-day periods
- Period selection depends entirely on your trading style—shorter periods for day trading, longer periods for position trading
What is Moving Average?
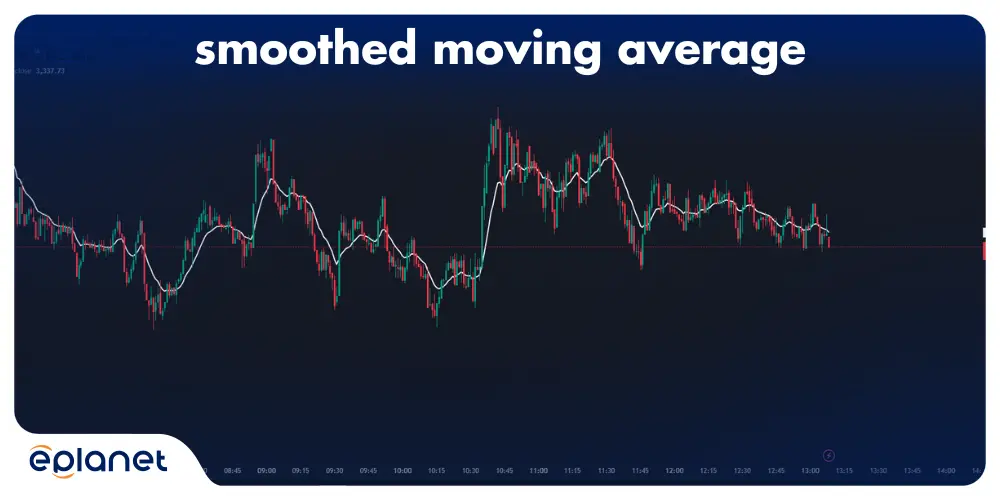
Picture this: you’re trying to follow a drunk person stumbling down the street. Their path zigzags wildly, making it impossible to predict their next move. Now imagine drawing a smooth line through the center of their chaotic journey—that’s essentially what a moving average does to stock prices.
A moving average is a technical indicator that creates a constantly updated average price over a specific time period. It’s like having a personal assistant who takes all the market’s emotional outbursts and presents you with a calm, measured summary of what’s really happening.
The beauty lies in its simplicity. While prices jump around like caffeinated squirrels, moving averages glide along smoothly, revealing the underlying trend that matters most to your bottom line.
Simple Moving Average: The Classic Choice
The simple moving average is like that reliable friend who never lets you down. It treats every price point equally, creating a democratic average that doesn’t play favorites with recent or older data.
Here’s why SMAs deserve a spot in your trading toolkit:
Stability: SMAs change gradually, filtering out short-term noise that might trigger false signals. When the market throws a tantrum, your SMA stays cool and collected.
Clarity: Because they’re slower to react, SMAs provide clearer trend identification. When price is above the SMA, you’re likely in an uptrend. Below it? Time to consider the bears might be in control.
Support and Resistance: Major SMAs like the 50-day and 200-day often act as dynamic support and resistance levels. I’ve watched countless stocks bounce off their 200-day SMA like it’s made of rubber.
SMA Trading Strategies
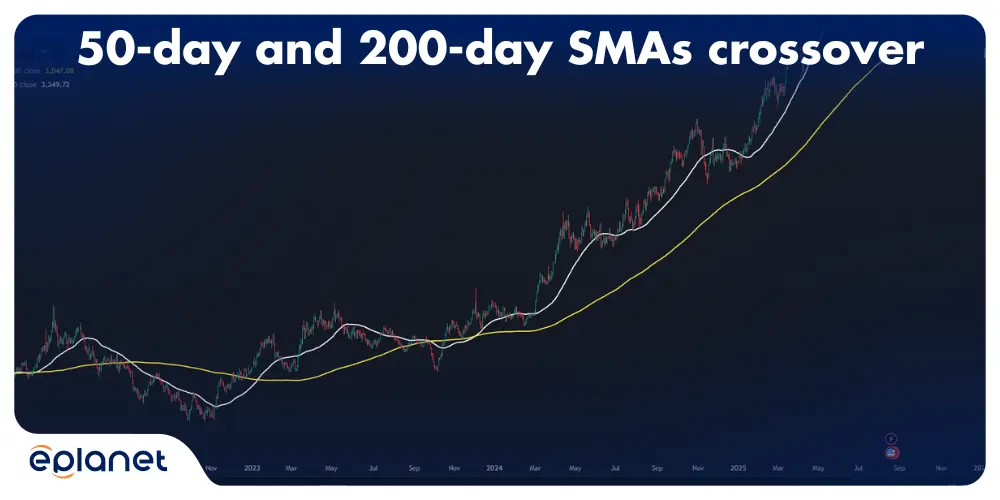
The most popular SMA strategy involves the golden cross and death cross:
- Golden Cross: 50-day SMA crosses above 200-day SMA (bullish signal)
- Death Cross: 50-day SMA crosses below 200-day SMA (bearish signal)
| Signal Type | Short MA | Long MA | Market Implication |
|---|---|---|---|
| Golden Cross | 50-day | 200-day | Strong bullish trend |
| Death Cross | 50-day | 200-day | Strong bearish trend |
| Mini Golden | 20-day | 50-day | Short-term bullish |
| Mini Death | 20-day | 50-day | Short-term bearish |
Exponential Moving Average: The Reactive Trader’s Best Friend
If SMAs are the tortoise, then exponential moving averages are definitely the hare—quick, responsive, and always ready to react to the latest market developments.
EMAs shine in volatile markets where quick decision-making separates profitable traders from those left holding the bag. By giving more weight to recent prices, EMAs catch trend changes faster than their simple cousins.
Why Traders Love EMAs:
Speed: EMAs respond to price changes more quickly, helping you catch trends earlier in their development. In fast-moving markets, this speed advantage can be worth thousands of dollars per trade.
Momentum: Because they emphasize recent price action, EMAs better reflect current market momentum—crucial for day traders and scalpers who live and die by split-second decisions.
Reduced Lag: While SMAs drag their feet, EMAs leap into action, reducing the lag time that can eat into your profits.
Weighted Moving Average: The Customizable Solution
Weighted moving averages are like having a bespoke suit made for your trading style. You decide exactly how much influence each period should have, creating a moving average that matches your specific needs perfectly.
WMAs split the difference between SMAs and EMAs, offering more customization than simple averages while maintaining more stability than exponential ones. They’re particularly popular among professional traders who need precise control over their indicators.
The most common weighting scheme gives the most recent period the highest weight (equal to the number of periods), the second most recent gets n-1 weight, and so on. For a 5-day WMA, the weights would be 5, 4, 3, 2, 1.
Moving Average Formula: The Mathematical Foundation
Understanding the moving average formula isn’t just academic exercise—it’s the difference between blindly following signals and truly comprehending what drives your trading decisions.
Simple Moving Average Formula
The simple moving average formula is refreshingly straightforward:
SMA = (P₁ + P₂ + P₃ + … + Pₙ) ÷ n
Where:
- P = Price for each period
- n = Number of periods
Let’s say you want a 5-day SMA for a stock that closed at $10, $12, $11, $13, and $14 over five days:
SMA = (10 + 12 + 11 + 13 + 14) ÷ 5 = $12
It’s that simple. Every day, you drop the oldest price and add the newest one, maintaining a rolling average that evolves with the market.
Exponential Moving Average Formula
The exponential moving average formula gets a bit spicier, giving more weight to recent prices:
EMA = (Current Price × Smoothing Factor) + (Previous EMA × (1 – Smoothing Factor))
The smoothing factor is typically calculated as: 2 ÷ (n + 1)
For a 10-day EMA, the smoothing factor would be 2 ÷ (10 + 1) = 0.1818
This formula ensures that yesterday’s price has more influence than last week’s, making EMAs more responsive to recent price movements—perfect for capturing those momentum shifts that can make or break a trade.
Weighted Moving Average Formula
The weighted moving average formula takes customization to the next level:
WMA = (P₁ × W₁ + P₂ × W₂ + … + Pₙ × Wₙ) ÷ (W₁ + W₂ + … + Wₙ)
Where W represents the weight assigned to each period. Typically, the most recent period gets the highest weight, decreasing linearly for older periods.
Moving Average Crossover: Where Magic Happens
Moving average crossover strategies are the bread and butter of technical analysis—simple to understand, powerful to implement, and profitable when executed correctly.
The concept is beautifully simple: when a faster moving average crosses above a slower one, it signals potential upward momentum. When it crosses below, bearish forces might be taking control.
Popular Crossover Combinations
The Classic Duo: 50-day and 200-day SMAs create the most widely watched crossover signals in the Forex world. When these titans cross, institutional traders take notice.
The Day Trader’s Friend: 9-day and 21-day EMAs provide more frequent signals perfect for shorter-term trading strategies.
The Scalper’s Edge: 5-minute and 15-minute EMAs offer rapid-fire signals for those brave enough to trade in the market’s fastest lanes.
Read More: the Best EMA for 5 Minute Charts
Here’s the thing about crossovers—they’re not crystal balls. They work best in trending markets and can whipsaw you to death in sideways action. The key is knowing when to trust them and when to step aside.
What Does the Moving Average Tell You?
Moving averages are like market psychologists, revealing the collective mood of buyers and sellers through elegant mathematical simplicity.
Trend Direction: When price consistently stays above a moving average, bulls are in control. Below it? The bears are running the show. It’s that straightforward.
Momentum Shifts: When faster moving averages cross slower ones, they’re telegraphing changes in market sentiment before they become obvious to casual observers.
Support and Resistance: Moving averages often act as dynamic support in uptrends and resistance in downtrends. I’ve seen stocks bounce off their 50-day moving average so many times it’s almost supernatural.
Market Strength: The slope of a moving average tells you how strong the current trend really is. A steeply rising MA suggests powerful bullish momentum, while a gently sloping one might indicate a tired trend ready for a breather.
Which is Better: 50-Day or 200-Day Moving Average?
Asking whether the 50-day or 200-day moving average is better is like asking whether a sports car or SUV is the superior vehicle—it depends entirely on what you’re trying to accomplish.
The 50-Day Moving Average is your medium-term trend identifier. It’s responsive enough to catch significant moves while filtering out daily noise that could mislead your analysis. Perfect for swing traders who want to ride trends for weeks or months.
The 200-Day Moving Average is the granddaddy of trend indicators—institutional investors’ favorite for determining long-term market health. When a stock trades above its 200-day MA, it’s officially in a bull market. Below it signals bear market territory.
Here’s my take after years of watching both: use them together. The 50-day shows you what’s happening now, while the 200-day provides crucial context about the bigger picture. When they align, you’ve got a powerful confluence of signals.
| Moving Average | Best For | Time Horizon | Signal Frequency |
|---|---|---|---|
| 50-Day | Swing Trading | Medium-term | Moderate |
| 200-Day | Position Trading | Long-term | Infrequent |
| Both Together | All Strategies | Multi-timeframe | Optimal |
Which Moving Average is Best?
The “best” moving average is like the perfect trading strategy—it doesn’t exist in isolation. The optimal choice depends on your trading style, risk tolerance, and market conditions.
For Day Trading: Short-period EMAs (5, 9, 12) provide quick signals perfect for capturing intraday momentum. They’re sensitive enough to catch rapid moves while still filtering some noise.
For Swing Trading: Medium-period SMAs or EMAs (20, 50) offer the sweet spot between responsiveness and stability. They catch multi-day trends without drowning you in false signals.
For Position Trading: Long-period SMAs (100, 200) help you ride major trends while ignoring short-term volatility that could shake you out of profitable positions.
The professionals I know don’t rely on just one moving average—they use multiple periods to create a comprehensive view of market dynamics across different timeframes.
What Moving Average to Use for Day Trading?
Day trading with moving averages is like performing surgery with a scalpel—you need precision, speed, and nerves of steel.
The 9-EMA and 21-EMA Combo: This pairing provides frequent crossover signals while maintaining enough stability to avoid complete chaos. When the 9 crosses above the 21, look for long opportunities. When it crosses below, consider shorts.
The 5-EMA: Ultra-sensitive and perfect for scalping, but be warned—this indicator will have you jumping in and out of positions like a caffeinated day trader at a Red Bull convention.
The 8-EMA and 20-EMA: A slightly more conservative approach that still captures intraday momentum while reducing some of the noise that plagues shorter periods.
Day trading success with moving averages requires strict discipline. Set your stop losses, stick to your plan, and never chase signals that have already moved significantly in your favor.
Can Moving Averages Act as Support and Resistance?
Absolutely—and this phenomenon is one of the most reliable patterns in technical analysis. Moving averages create dynamic support and resistance levels that evolve with price action.
In Uptrends: Moving averages often provide support when prices pull back. The 20-day, 50-day, and 200-day MAs frequently act as stepping stones during healthy corrections.
In Downtrends: These same levels become resistance, capping rallies and providing excellent short-selling opportunities for nimble traders.
The Psychology: This happens because millions of traders watch these same levels. When price approaches a major moving average, buying and selling pressure naturally concentrates around these widely-followed technical levels.
I’ve witnessed stocks bounce off their 50-day moving average with such precision that it seems almost magical—but it’s really just mass psychology playing out in real-time market action.
Where is Moving Average in TradingView?
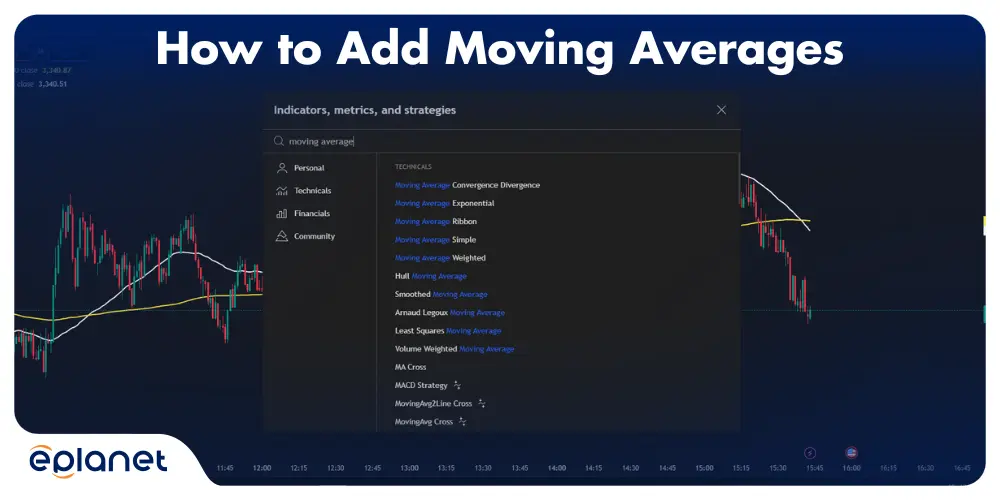
Finding moving averages in TradingView is easier than ordering coffee at Starbucks:
- Open your chart and look for the “Indicators” button at the top
- Click the “f” icon or press “/” on your keyboard
- Type “Moving Average” in the search box
- Select your preferred type: MA, EMA, or WMA from the dropdown
- Customize the settings: Adjust period, style, and colors to match your preferences
Pro Tip: You can add multiple moving averages with different colors and periods. I typically use blue for short-term, red for medium-term, and black for long-term MAs to create a visual hierarchy that makes trend analysis instantaneous.
TradingView also offers advanced MA variants like:
- TEMA (Triple Exponential Moving Average)
- DEMA (Double Exponential Moving Average)
- HMA (Hull Moving Average)
- ALMA (Arnaud Legoux Moving Average)
Can Moving Averages Be Used to Forecast?
Here’s the hard truth: moving averages don’t predict the future—they interpret the past and present to help you make informed decisions about what might happen next.
Moving averages are lagging indicators, meaning they confirm trends rather than predict them. They’re like looking in your rearview mirror while driving—helpful for understanding where you’ve been, but you still need to watch the road ahead.
What They Can Do:
- Identify trend direction and strength
- Signal potential trend changes through crossovers
- Provide dynamic support and resistance levels
- Filter market noise for clearer analysis
What They Cannot Do:
- Predict exact turning points
- Tell you when trends will end
- Work effectively in choppy, sideways markets
- Guarantee profitable trades
The key is using moving averages as part of a comprehensive trading strategy that includes risk management, fundamental analysis, and other technical indicators.
Best Moving Average for Forex Trading
Forex markets never sleep, and neither should your moving average strategy. The 24-hour nature of currency trading creates unique opportunities for MA-based strategies.
The Forex Favorites:
20-EMA: Perfect for capturing short-term momentum in major currency pairs. The high liquidity of forex markets makes this period responsive without being overly noisy.
50-SMA and 200-SMA: These longer-period averages help identify major trend changes in currency pairs, especially useful for position traders who want to ride long-term moves.
The Triple EMA System: Using 8-EMA, 21-EMA, and 55-EMA creates a comprehensive trend-following system that works exceptionally well in trending forex markets.
Currency Pair Considerations:
- Major Pairs (EUR/USD, GBP/USD): Standard periods work well due to high liquidity
- Minor Pairs: Slightly longer periods help filter additional noise
- Exotic Pairs: Longer periods essential due to lower liquidity and wider spreads
| Forex Strategy | Short MA | Long MA | Best Timeframe |
|---|---|---|---|
| Scalping | 5-EMA | 15-EMA | 1-5 minutes |
| Day Trading | 9-EMA | 21-EMA | 15-30 minutes |
| Swing Trading | 20-SMA | 50-SMA | 4-hour to daily |
| Position Trading | 50-SMA | 200-SMA | Daily to weekly |
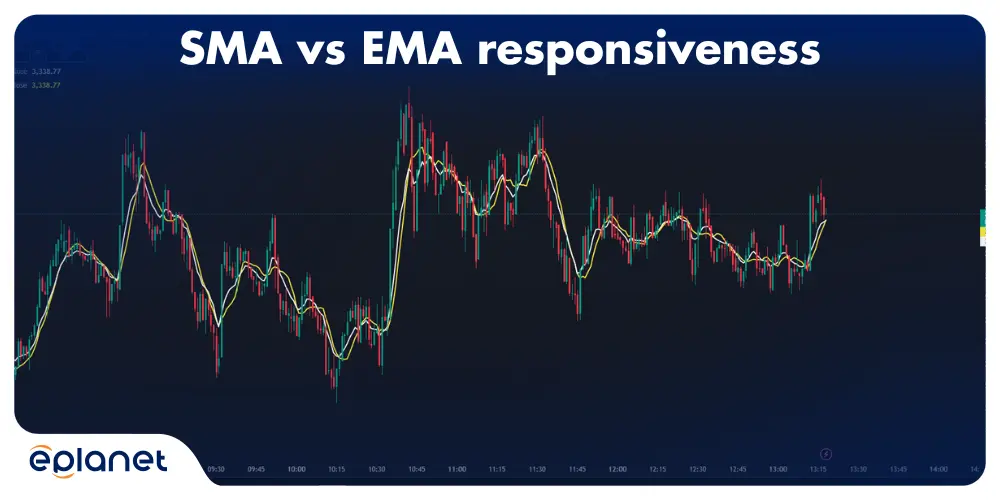
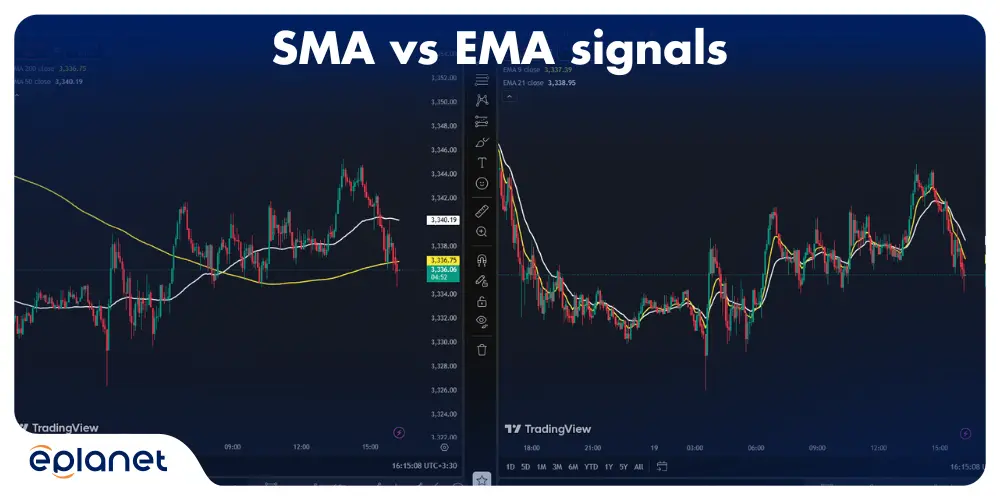
SMA vs EMA Trading: The Ultimate Showdown
The battle between SMA vs EMA trading strategies has raged in trading circles for decades, with passionate advocates on both sides wielding charts like medieval weapons.
Simple Moving Average Advantages
Stability: SMAs provide smoother signals with fewer false breakouts. When market volatility spikes, SMAs keep you grounded with steady, reliable trend identification.
Clarity: The equal weighting of all periods creates cleaner trend lines that are easier to interpret, especially for beginning traders who might get overwhelmed by too much sensitivity.
Less Whipsaw: In choppy markets, SMAs generate fewer false signals that could trigger premature entries or exits.
Exponential Moving Average Advantages
Responsiveness: EMAs catch trend changes faster, helping you enter positions earlier in developing moves and exit before major reversals become painful.
Momentum Reflection: By emphasizing recent price action, EMAs better capture current market sentiment and momentum shifts.
Reduced Lag: The mathematical weighting reduces the inherent lag that makes all moving averages somewhat backward-looking.
The Verdict
After trading both extensively, I’ve concluded that the choice depends entirely on your trading personality and market conditions:
- Trending Markets: EMAs excel, capturing momentum and keeping you in profitable positions longer
- Choppy Markets: SMAs win, filtering noise and preventing overtrading
- Risk Tolerance: Conservative traders prefer SMAs; aggressive traders gravitate toward EMAs
The smartest approach? Use both. Combine a fast EMA with a slower SMA to get the best of both worlds—early signals with confirmation stability.
How to Choose Moving Average Period
Selecting the right moving average period is like choosing the perfect golf club—use the wrong one, and you’ll end up in the rough every time.
Factor #1: Trading Timeframe
Scalping (1-5 minutes): Ultra-short periods (5-15) capture rapid price movements.
Day Trading (15-60 minutes): Short periods (9-21) balance sensitivity with stability.
Swing Trading (4-hour to daily): Medium periods (20-50) filter noise while catching multi-day moves.
Position Trading (daily to weekly): Long periods (50-200) identify major trend changes.
Factor #2: Market Volatility
High volatility markets need longer periods to filter noise, while stable markets can use shorter periods without generating excessive false signals.
Factor #3: Personal Risk Tolerance
Conservative traders should lean toward longer periods for fewer, higher-confidence signals. Aggressive traders can handle shorter periods with more frequent trading opportunities.
Factor #4: Market Type
Stocks: Traditional periods (20, 50, 200) work well due to widespread adoption.
Forex: Slightly modified periods (21, 55) can be more effective.
Crypto: Shorter periods often necessary due to 24/7 trading and high volatility.
Commodities: Longer periods help filter seasonal and supply-demand noise.
Moving Average Trading Strategies That Actually Work
Let me share some battle-tested moving average strategies that have consistently generated profits across different market conditions:
Strategy #1: The Golden Cross System
Setup: 50-day SMA crosses above 200-day SMA.
Entry: Buy on the crossover or pullback to the 50-day MA.
Stop Loss: Below recent swing low or 200-day MA.
Target: Previous resistance levels or 20% gain.
This strategy caught Apple’s massive run in 2009 and Tesla’s moonshot in 2020. It’s not fast, but it’s devastatingly effective in bull markets.
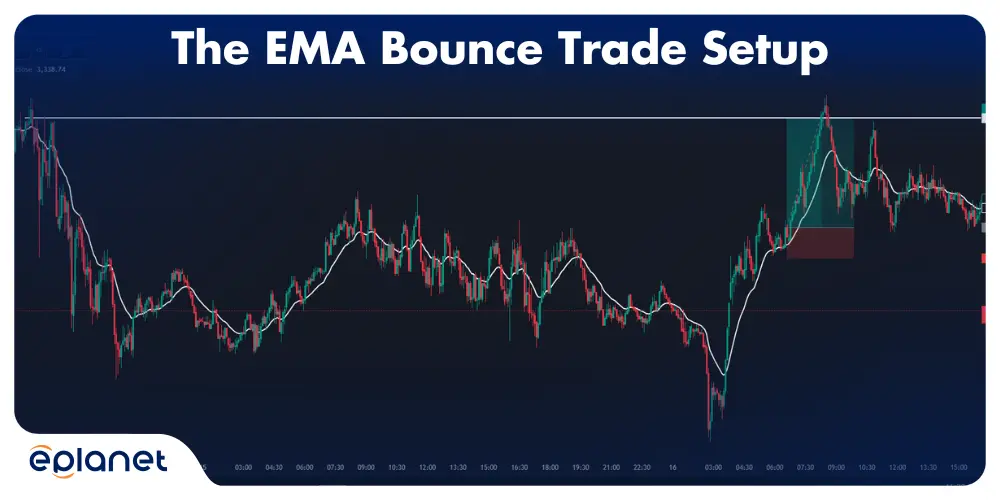
Strategy #2: The EMA Bounce
Setup: Price pulls back to rising 20-EMA in an uptrend.
Entry: Buy when price shows reversal signals near the EMA.
Stop Loss: Below the EMA.
Target: Previous highs or resistance levels.
This strategy excels in trending markets where the EMA acts as dynamic support.
Strategy #3: The Triple EMA Crossover
Setup: Use 8-EMA, 21-EMA, and 55-EMA.
Entry: When all three EMAs align with 8 > 21 > 55 (bullish) or 8 < 21 < 55 (bearish).
Stop Loss: Beyond the 55-EMA.
Target: Measured moves based on previous swings.
This system provides multiple confirmation levels while maintaining reasonable sensitivity.
Common Moving Average Mistakes to Avoid
After watching traders blow up accounts with moving averages, here are the critical mistakes you must avoid:
Mistake #1: Using Only One Moving Average
Single moving averages generate too many false signals. Always use at least two for confirmation—preferably with different calculation methods or periods.
Mistake #2: Ignoring Market Context
Moving averages work poorly in sideways markets. Learn to recognize choppy conditions and step aside when trends aren’t clearly established.
Mistake #3: Chasing Every Crossover
Not all crossovers are created equal. Wait for clear breaks with volume confirmation and favorable risk/reward setups.
Mistake #4: Wrong Period Selection
Using periods that don’t match your trading style creates internal conflict and poor decision-making. Day traders shouldn’t use 200-day MAs, and position traders shouldn’t obsess over 5-minute EMAs.
Mistake #5: No Risk Management
Moving averages don’t eliminate risk—they help manage it. Always use stop losses and position sizing appropriate for your account size.
Advanced Moving Average Techniques
Once you’ve mastered the basics, these advanced techniques can significantly improve your moving average game:
Technique #1: Multiple Timeframe Analysis
Use longer timeframes to identify trend direction, then drop to shorter timeframes for precise entries. A stock above its daily 200-SMA with an hourly golden cross provides powerful confluence.
Technique #2: Volume-Weighted Moving Averages
Standard MAs ignore volume, but VWMA incorporates trading volume into the calculation, providing better representation of institutional interest.
Technique #3: Displacement and Projection
Shift moving averages forward in time to anticipate future support/resistance levels, or backward to reduce lag in trend identification.
Technique #4: Moving Average Ribbons
Plot multiple MAs with slightly different periods to create a ribbon effect. When ribbons expand, trends are strengthening. When they contract, expect consolidation or reversal.
Frequently Asked Questions
What is the most accurate moving average?
No single moving average is universally accurate—effectiveness depends on market conditions and trading style. EMAs excel in trending markets, while SMAs perform better in choppy conditions. Most professional traders use combinations of different MA types and periods for comprehensive analysis.
Should I use SMA or EMA for swing trading?
For swing trading, I recommend using both: a 20-day SMA for trend identification combined with a 12-day EMA for entry signals. This combination provides the stability of SMAs with the responsiveness of EMAs, perfect for capturing multi-day moves.
How do moving averages help with risk management?
Moving averages provide dynamic stop-loss levels and trend confirmation. Place stops below rising MAs in uptrends or above falling MAs in downtrends. They also help you avoid trading against major trends, reducing the likelihood of catastrophic losses.
Can moving averages predict market crashes?
Moving averages cannot predict crashes, but they can help identify deteriorating market conditions. Death crosses (50-MA crossing below 200-MA) and price breaking major MA support often precede significant declines, providing early warning signals.
What’s the difference between adaptive and traditional moving averages?
Adaptive moving averages (like Kaufman’s AMA) automatically adjust their sensitivity based on market volatility. They become more responsive in trending markets and less sensitive in choppy conditions, potentially offering superior performance across varying market environments.
Conclusion
Moving averages aren’t just mathematical curiosities—they’re powerful tools that can transform your trading results when used correctly. From the stability of simple moving averages to the responsiveness of exponential ones, each type serves a specific purpose in your analytical arsenal.
The key to success lies not in finding the “perfect” moving average, but in understanding how different types work across various market conditions and timeframes. Start with the classics—50-day and 200-day SMAs for trend identification, then experiment with EMAs for more sensitive signals.
Remember, moving averages work best as part of a comprehensive trading strategy that includes proper risk management, volume analysis, and fundamental considerations. They’re guides, not guarantees—use them to inform your decisions, not make them automatically.