

Ever wondered why your perfectly placed stop-loss gets hit just before the market rockets in your intended direction? Welcome to the world of liquidity grabs – where institutional players feast on retail traders’ predictable positions. Understanding these sophisticated market manipulation tactics isn’t just about avoiding losses; it’s about positioning yourself on the winning side of the trade.
Key Takeaways
- Liquidity grabs are deliberate market moves where institutional traders target clusters of stop-losses and pending orders to create favorable entry conditions.
- Smart money concepts reveal institutional behavior through price action patterns that show where big players are accumulating or distributing positions.
- Identifying liquidity zones requires analyzing key support/resistance levels where retail traders typically place their stops and pending orders.
- Timing is everything – the best liquidity grabs happen during high-impact news releases or at key technical levels when maximum retail participation occurs.
- Prevention beats reaction – understanding these patterns helps you avoid being the liquidity provider and potentially profit from the moves.
What is Liquidity Grab
Picture this: You’re at a poker table, and everyone’s cards are face-up except yours. That’s essentially what institutional traders have – they can see where retail orders cluster, while you’re trading blind. A liquidity grab is when these smart money players deliberately move price to trigger stop-losses and pending orders, creating the liquidity they need for their massive positions.
Think of it like a perfectly orchestrated heist. The big players know exactly where the treasure is buried (your stop-losses), they have the tools to dig it up (massive capital), and they execute the plan when conditions are perfect (low liquidity periods).
The beauty – or horror, depending on which side you’re on – lies in the simplicity. Retail traders love round numbers, obvious support and resistance levels, and textbook patterns. Institutions know this, so they use it against us.
Smart Money Liquidity Concepts
Here’s where things get interesting. Smart money doesn’t just randomly grab liquidity – they follow specific behavioral patterns that you can actually learn to recognize. It’s like learning to read poker tells, but instead of watching facial expressions, you’re watching price action.
The Institutional Mindset
Institutional traders think differently than retail traders. While you might be happy with a 2% gain, they’re moving billions and need substantial liquidity to enter and exit positions without causing massive slippage. They can’t just click “buy” on a million shares – they need counterparties, and retail stop-losses provide exactly that.
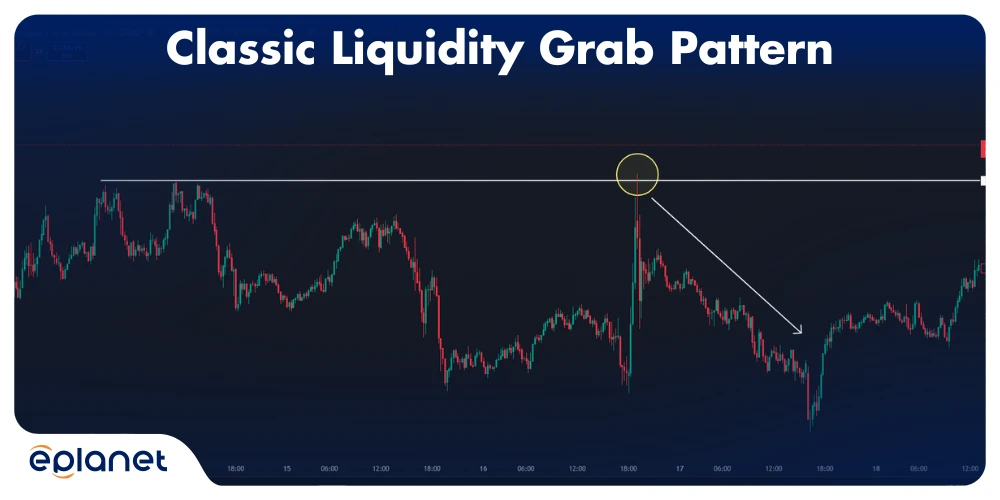
I remember watching a EUR/USD chart during the London session once. Price was sitting right at a key support level, and you could practically feel the tension. Retail traders were long with stops just below support, while smart money was patiently waiting. Then boom – a quick spike down, thousands of stops triggered, and price reversed like nothing happened. Classic liquidity grab.
Market Structure Analysis
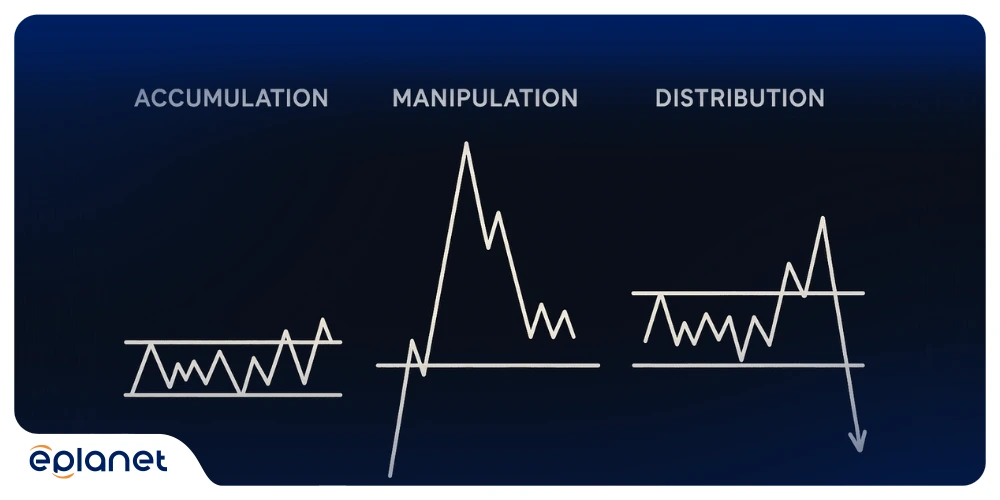
Understanding market structure is crucial for identifying potential liquidity grab scenarios. Institutional players typically operate in three distinct phases that flow seamlessly into each other.
During the accumulation phase, smart money quietly builds positions during low-volatility periods, often when retail traders are bored or distracted. This is followed by the manipulation phase, where the liquidity grab happens as price moves against the intended direction to trigger stops and grab liquidity. Finally, the distribution phase begins where the real move starts – smart money has their position, retail traders are out, and price moves in the intended direction.
Liquidity Grab Strategy
Now that you understand the concept, let’s dive into practical strategies. Remember, the goal isn’t to fight the institutions – it’s to recognize their footprints and follow their lead.
Identifying High-Probability Setups
The most effective liquidity grab strategies focus on areas where retail traders predictably place their orders. These “liquidity pools” are like honey pots for institutional traders.
You’ll want to pay close attention to previous day’s high and low levels, weekly and monthly extremes, and those psychologically important round numbers like 1.2000 or 1.2500. Obvious support and resistance levels are also prime targets, along with equal highs or lows where multiple touches have created clear, well-defined levels that everyone can see.
The Setup Process
When I analyze charts for potential liquidity grabs, I follow a systematic approach that’s helped me avoid countless false breakouts and even profit from some institutional moves.
First, I identify the liquidity zones. These are areas where retail traders are most likely to place stops. Think about it – if you were long EUR/USD and saw a clear support level, where would you put your stop? Probably just below that level, right? So would thousands of other traders.
Next, I look for signs of institutional interest. This might be repeated tests of a level, decreasing volume on each test, or price action that seems “too clean” – like it’s being managed.
Finally, I watch for the trigger event. This could be news, a key time of day (like the London or New York open), or simply the accumulation of enough retail positions to make the grab worthwhile.
Liquidity Grab Forex Chart Examples
Let me walk you through some real-world examples that showcase how these patterns play out in the forex market.
Example 1: EUR/USD Daily Chart
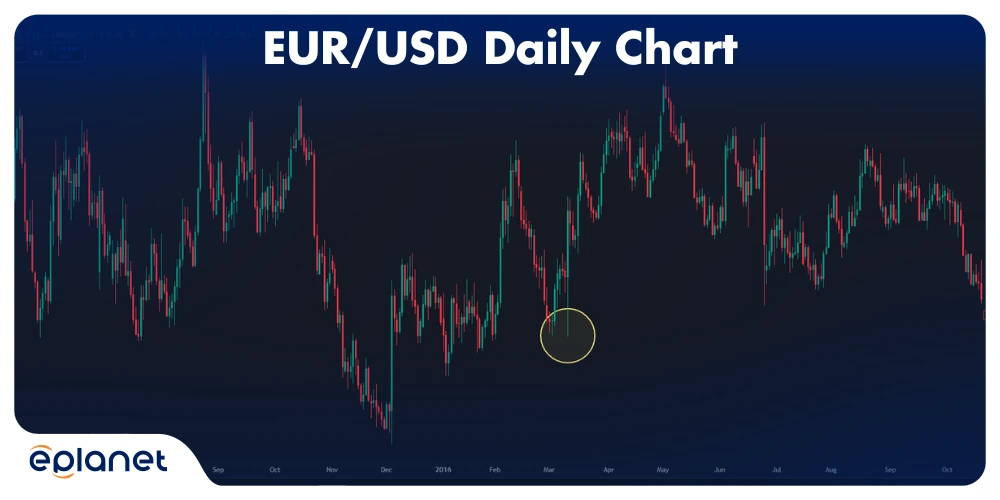
In this example, EUR/USD had been trending higher, creating a series of higher highs and higher lows. Retail traders were naturally bullish, placing stops below each swing low. Smart money identified the cluster of stops below the most recent swing low and executed a perfect liquidity grab.
Notice how price spiked down just far enough to trigger the stops, then immediately reversed. The volume spike during the grab confirms that significant liquidity was taken. What followed was a strong move higher – exactly what smart money intended.
Example 2: GBP/JPY 4-Hour Chart
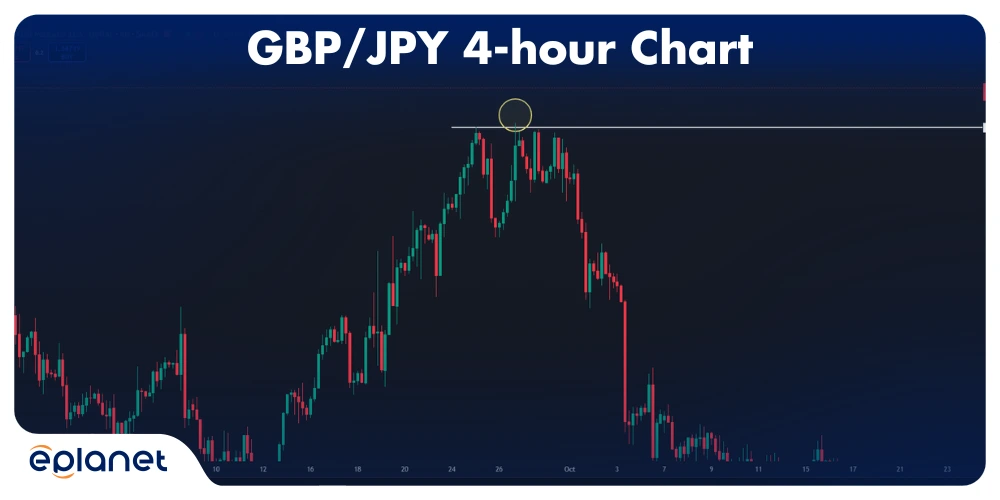
This GBP/JPY setup shows the flip side – a liquidity grab above resistance. Retail traders who were short had placed their stops above the obvious resistance level. Smart money swept these stops before initiating a strong downward move.
The key here is recognizing that the initial breakout was false. The quick reversal after hitting the stops is a dead giveaway that this was a liquidity grab rather than a genuine breakout.
Liquidity Grab vs Liquidity Sweep
Understanding the difference between a liquidity grab and a liquidity sweep is crucial for proper trade management. While they might seem similar, they serve different purposes in the institutional playbook.
Liquidity Grab Characteristics
A liquidity grab is typically a sharp, aggressive move designed to quickly trigger stops and create instant liquidity. These moves are usually short-lived, lasting anywhere from minutes to hours, and are followed by immediate reversal. You’ll notice they’re accompanied by volume spikes and specifically target those obvious stop-loss levels where retail traders cluster their orders.
Liquidity Sweep Characteristics
A liquidity sweep, on the other hand, is more methodical. It’s like a slow-motion version of a grab, where price gradually works through multiple liquidity levels. These moves are more sustained, lasting hours to days, and take a methodical approach that’s often disguised as normal price movement. Instead of targeting a single liquidity pool, sweeps systematically work through multiple levels.
| Feature | Liquidity Grab | Liquidity Sweep |
|---|---|---|
| Speed | Very fast | Gradual |
| Duration | Minutes to hours | Hours to days |
| Reversal | Immediate | Delayed or none |
| Volume | Spike pattern | Steady increase |
| Target | Single liquidity pool | Multiple levels |
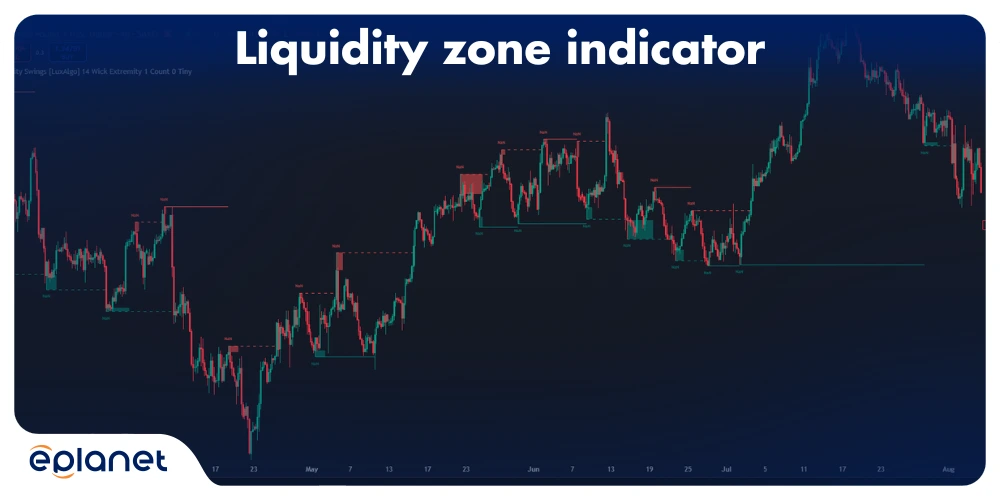
Liquidity Grab Indicator
While there’s no magic indicator that screams “liquidity grab incoming,” certain tools can help you identify potential setups. The key is combining multiple indicators with price action analysis.
Volume Analysis
Volume is your best friend when identifying liquidity grabs. Genuine breakouts typically maintain or increase volume, while liquidity grabs show a volume spike followed by declining volume as price reverses.
I use a simple volume indicator with a 20-period moving average. When volume spikes significantly above the average during a breakout, but then quickly falls back below average as price reverses, it’s often a liquidity grab.
Market Profile Tools
Market profile indicators show where most trading activity occurs. Areas with high volume but few transactions often indicate institutional activity, while areas with low volume but many transactions suggest retail participation.
Custom Liquidity Indicators
Some traders create custom indicators that highlight potential liquidity zones. These typically mark:
- Previous day/week/month highs and lows
- Round number levels
- Areas of equal highs or lows
- Fibonacci retracement levels
Best Indicators for Spotting Liquidity Grabs
After years of analyzing these patterns, I’ve found that combining traditional indicators with price action analysis gives the best results. Here’s my go-to setup:
Primary Indicators
Volume Weighted Average Price (VWAP): This shows where institutions are likely active. Price action around VWAP levels often precedes liquidity grabs.
Time and Sales Data: For those with access to level II data, watching the order flow can reveal institutional activity before it shows up on price charts.
Market Profile: Understanding where value is being accepted or rejected helps identify potential liquidity zones.
Secondary Indicators
Relative Strength Index (RSI): Divergences between price and RSI around key levels often signal potential liquidity grabs.
Moving Average Convergence Divergence (MACD): Similar to RSI, MACD divergences can highlight institutional accumulation or distribution.
Bollinger Bands: Squeezes followed by expansion often coincide with liquidity grab events.
The Confirmation Setup
I never rely on a single indicator. Instead, I look for confluence:
- Price approaching a known liquidity zone
- Volume patterns suggesting institutional interest
- Technical indicators showing potential reversal signals
- Time-based factors (key session opens, news events, etc.)
Is a Liquidity Grab Bullish or Bearish?
This is where many traders get confused. The direction of the liquidity grab doesn’t necessarily indicate the future direction of the market. In fact, it often indicates the opposite.
Understanding the Misdirection
A liquidity grab below support is often followed by a bullish move. Why? Because smart money grabbed all the sell stops, creating buy liquidity, and now they can push price higher with less resistance.
Conversely, a liquidity grab above resistance is often followed by a bearish move. The institutional players grabbed all the buy stops, creating sell liquidity, and now they can push price lower.
The Contrarian Nature
Think of liquidity grabs as institutional traders playing the ultimate contrarian game. They’re betting against the obvious move, and they have the firepower to make it happen. When everyone expects a breakdown below support, they grab the liquidity and push higher. When everyone expects a breakout above resistance, they grab the liquidity and push lower.
This is why the most profitable trades often feel wrong initially. You’re essentially betting that the obvious move is the wrong move – and in the world of liquidity grabs, that’s often correct.
What is the Difference Between Choch and Liquidity Grab?
Change of Character (ChoCh) and liquidity grabs are related but distinct concepts in smart money analysis. Understanding the difference helps you better time your entries and exits.
Change of Character (ChoCh)
A ChoCh represents a shift in market sentiment or institutional positioning. It’s typically characterized by breaking market structure (whether that’s higher highs and higher lows, or lower highs and lower lows), a sustained move in the new direction, volume confirmation of the new trend, and follow-through over multiple sessions.
Liquidity Grab vs ChoCh
A liquidity grab is often the mechanism that creates a ChoCh. The process flows naturally from setup to execution: first, the market establishes a trend with clear structure. Then smart money triggers stops to gain positioning through a liquidity grab. This is followed by ChoCh confirmation as price breaks market structure, confirming the new direction. Finally, the new trend continues with institutional backing.
The key difference is timing and intent. A liquidity grab is a tactical move to improve positioning, while a ChoCh is a strategic shift in market direction.
What is the Difference Between a Breakout and a Liquidity Grab?
This distinction is crucial for successful trading. Many traders get stopped out because they can’t tell the difference between a genuine breakout and a liquidity grab.
Genuine Breakout Characteristics
A real breakout typically shows sustained volume that remains elevated after the initial move, strong follow-through where price continues in the breakout direction, clear structural confirmation where market structure definitively breaks, and a time factor where the move sustains over multiple sessions.
Liquidity Grab Characteristics
A liquidity grab shows a distinctly different pattern: an initial volume spike followed by declining volume, quick reversal where price rapidly returns to the previous range, minimal follow-through with little to no continuation in the breakout direction, and timing coincidence where the move often occurs during low liquidity periods.
| Feature | Genuine Breakout | Liquidity Grab |
|---|---|---|
| Volume pattern | Sustained high | Spike then decline |
| Follow-through | Strong | Minimal |
| Reversal speed | Slow/none | Fast |
| Structure break | Clear | Temporary |
| Success rate | High | Low (for breakout traders) |
What is Liquidity Grab in Stocks
Stock market liquidity grabs follow similar principles to forex, but with some unique characteristics due to market structure differences.
Stock-Specific Considerations
Earnings announcements create unique opportunities as companies often see liquidity grabs before earnings, with institutions positioning for expected moves. Market cap plays a crucial role too – large-cap stocks are less susceptible to liquidity grabs due to higher natural liquidity, while small-cap stocks can be more easily manipulated. During sector rotation periods, liquidity grabs become particularly common as institutions exit one sector and enter another.
Common Stock Liquidity Grab Scenarios
Pre-market manipulation stands out as institutions often execute liquidity grabs during pre-market hours when retail participation is low. Around options expiration dates, you’ll frequently see these grabs as institutions manage their options positions. Ex-dividend dates also create opportunities as institutional players adjust their positions around these events.
Liquidity Grab Examples in Stock Market
Let me share some real examples from the stock market that illustrate these concepts clearly.
Example 1: Apple (AAPL) Earnings Play
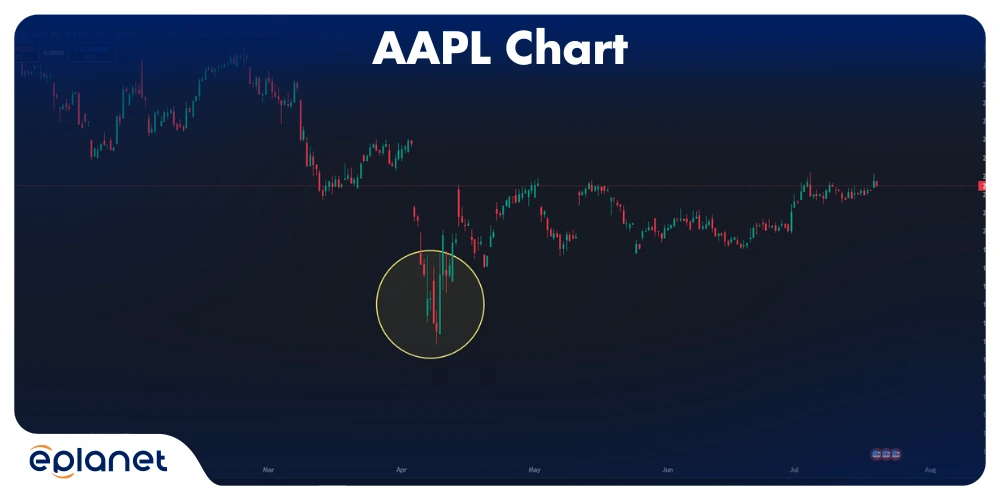
Before Apple’s Q3 earnings announcement, the stock had been consolidating near $180. Retail traders were positioned for a breakout above $185 (obvious resistance) with stops below $175 (obvious support).
Smart money executed a perfect liquidity grab, pushing price down to $174 in pre-market trading, triggering thousands of stops. Then, as earnings were released and showed strong results, price rocketed to $192. Those who understood the liquidity grab pattern could have entered long positions during the grab instead of being stopped out.
Example 2: Tesla (TSLA) Sector Rotation
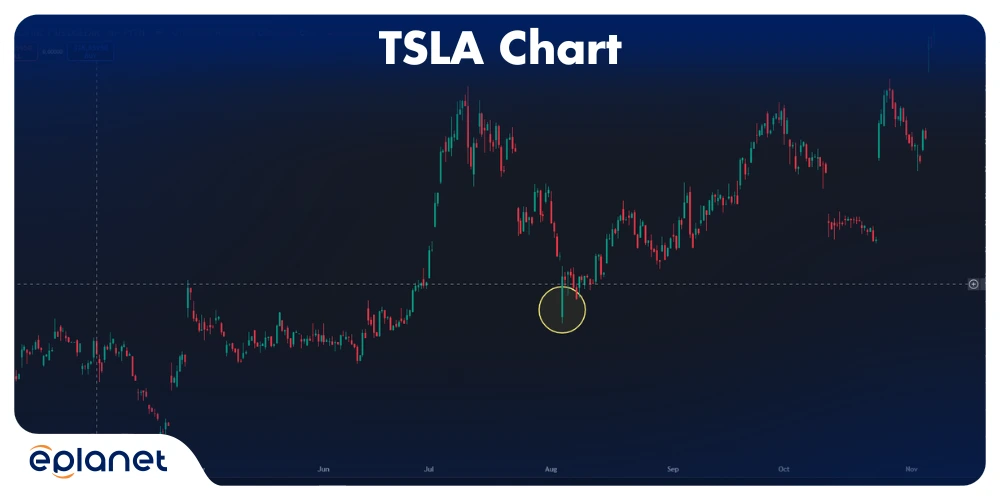
During a period of EV sector weakness, Tesla experienced a classic liquidity grab. Price had been respecting the $200 support level, with obvious retail stops placed just below at $195.
Institutional players, likely looking to accumulate Tesla shares at better prices, pushed price down to $193, triggering the stops. The massive volume spike confirmed the liquidity grab, and within days, price had recovered to $220 as smart money’s accumulation phase began.
How to Identify Liquidity Grab in Forex
Forex markets offer some of the clearest liquidity grab patterns due to their decentralized nature and 24-hour trading. Here’s my systematic approach to identifying these setups.
Time-Based Analysis
London Session Open (8:00 AM GMT): This is prime time for liquidity grabs. Retail traders have placed orders overnight, and smart money sweeps these levels as liquidity increases.
New York Session Open (1:00 PM GMT): Another high-probability time, especially for USD pairs. The overlap with London creates perfect conditions for institutional moves.
Asian Session Lows: Often, smart money will grab liquidity during the quiet Asian session, setting up for the main move during London or New York.
Currency-Specific Patterns
EUR/USD: Tends to show liquidity grabs around key psychological levels (1.2000, 1.1500, etc.) and ECB announcement times.
GBP/JPY: Known for volatile liquidity grabs, especially around Bank of England announcements and Brexit-related news.
USD/JPY: Often sees liquidity grabs during Bank of Japan intervention rumors or actual interventions.
Technical Setup Identification
I use a three-step process:
- Mark the Liquidity Zones: Identify where retail stops are likely clustered
- Watch for Smart Money Signals: Look for signs of institutional accumulation or distribution
- Wait for the Trigger: Be patient and wait for the actual liquidity grab to occur
Liquidity Grab vs Stop Hunting
While these terms are often used interchangeably, there are subtle but important differences between liquidity grabs and stop hunting.
Stop Hunting Characteristics
Stop hunting is typically:
- More aggressive and obvious
- Designed primarily to trigger stops
- Often followed by continuation in the hunt direction
- Usually shorter-term focused
- Less sophisticated in execution
Liquidity Grab Characteristics
Liquidity grabs are:
- More subtle and strategic
- Designed to create favorable positioning
- Often followed by reversal
- Part of a larger institutional strategy
- More sophisticated in execution
Think of stop hunting as a smash-and-grab robbery – quick, obvious, and focused on immediate results. Liquidity grabs are more like a chess game – strategic, patient, and focused on long-term positioning.
How to Profit from Liquidity Grabs
Now for the good stuff – how to actually make money from understanding these patterns. I’ve developed a systematic approach that has helped me turn these institutional moves into profitable opportunities.
The Fade Strategy
The most straightforward approach is to fade the liquidity grab. When you see price spike to grab liquidity, you position yourself for the reversal. My systematic approach involves first identifying the liquidity zone and waiting patiently for the grab to occur. Once I see the grab happening, I confirm it with volume analysis to ensure it’s genuine. Then I enter on the reversal with tight stops and target the opposite side of the range for my profit objective.
The Follow Strategy
Sometimes, the liquidity grab is just the beginning of a larger institutional move. Instead of fading, you follow smart money’s lead. This approach works particularly well when the grab breaks significant market structure, volume continues to support the new direction, multiple timeframes align with the move, and overall market sentiment supports the new direction.
Risk Management
Trading liquidity grabs requires strict risk management because you’re essentially trying to pick turning points. I never risk more than 1% of my account on a single liquidity grab trade since these setups can be tricky, and you need to survive the learning curve. I always use stops, but I place them logically rather than where other retail traders would put them – that’s just asking to be liquidity grabbed yourself. I also set time limits because if the setup doesn’t work within a reasonable timeframe, I exit rather than letting a liquidity grab trade turn into a long-term position.
Read More: Forex risk management strategies
Best Timeframes to Spot Liquidity Grabs
Different timeframes offer different advantages for identifying and trading liquidity grabs. Here’s my breakdown of the most effective approaches:
Daily Charts
Daily charts offer clear identification of major liquidity zones with less noise and false signals, making them perfect for swing trading approaches where you can easily spot institutional accumulation and distribution patterns. However, they require slower trade execution, provide less frequent opportunities, and demand more patience from traders.
4-Hour Charts
This is my sweet spot for liquidity grab trading. The 4-hour timeframe offers an excellent balance between signal clarity and frequency, aligns perfectly with major session times, provides sufficient liquidity for institutional moves, and creates manageable risk-reward ratios.
1-Hour Charts
One-hour charts provide more frequent opportunities and work well for day trading, offering quick identification of grab completion and good potential for scalping strategies. The downside is they generate more false signals, require higher stress and screen time, and demand constant monitoring.
Lower Timeframes (15-minute, 5-minute)
I generally avoid these for liquidity grab trading because they contain too much noise, produce frequent false signals, come with high transaction costs, and create emotional trading pressure that can cloud judgment.
Advanced Liquidity Grab Strategies
Once you understand the basics, you can develop more sophisticated approaches to trading these patterns.
The Multi-Timeframe Approach
I use three timeframes simultaneously, each serving a specific purpose in my analysis. The daily chart helps me identify major liquidity zones and overall trend direction. The 4-hour chart is perfect for setup identification and entry timing. The 1-hour chart provides precise entry and exit points. This approach helps filter out false signals and significantly increases the probability of successful trades.
The Sentiment Overlay
Combining liquidity grab analysis with market sentiment indicators can significantly improve your success rate. I track COT (Commitment of Traders) reports to understand institutional positioning, monitor VIX and currency volatility since high volatility often precedes liquidity grabs, and follow news flow because major announcements create perfect grab conditions.
The Correlation Game
In forex, currency correlations can help predict liquidity grabs. For example, if EUR/USD shows a liquidity grab setup, I’ll check GBP/USD for confirmation. Commodity currencies often move together during grab events, and safe-haven flows can create predictable grab patterns that you can anticipate.
Common Mistakes to Avoid
After years of trading and teaching these concepts, I’ve seen the same mistakes repeatedly. Here are the biggest pitfalls to avoid:
Mistake 1: Trying to Predict Every Grab
Not every level will result in a liquidity grab. Sometimes price just breaks and continues. Don’t force trades – wait for high-probability setups with multiple confirmation factors.
Mistake 2: Ignoring Volume
Volume is crucial for confirming liquidity grabs. Without volume analysis, you’re trading blind. Always check volume patterns before entering trades.
Mistake 3: Poor Position Sizing
These trades can be volatile. Many traders risk too much on a single setup and get wiped out during the learning phase. Start small and gradually increase position sizes as you gain experience.
Mistake 4: Emotional Trading
Liquidity grabs can be frustrating because they often trigger your stops first. Don’t let emotion drive your decisions. Stick to your plan and trust the process.
The Psychology Behind Liquidity Grabs
Understanding why these patterns work helps you trade them more effectively. It’s all about human psychology and market dynamics.
Retail Trader Psychology
Retail traders are predictable in their behavior patterns. We naturally gravitate toward round numbers and obvious levels, consistently place stops in the same logical places, become emotional when stopped out, and often re-enter trades in the same direction after being stopped out.
Institutional Trader Psychology
Institutional traders understand retail psychology and exploit it systematically. They know exactly where retail stops cluster, have the massive capital required to move markets, think in terms of risk and reward over much longer timeframes, and use retail predictability as a strategic tool rather than fighting against it.
Market Structure Dynamics
The entire financial system is set up to favor institutional players. They have access to better information flow, enjoy significantly lower transaction costs, use more sophisticated analytical tools, and wield greater market influence. Understanding this dynamic helps you position yourself correctly – not as a victim of the system, but as someone who understands how it works and can adapt accordingly.
Real-World Application
Let me share how I actually use this knowledge in my daily trading routine.
Morning Routine
Every morning, I start by checking overnight price action for potential grabs, then mark key liquidity zones on my charts. I review the economic calendar for potential trigger events and set alerts for key levels that might see action during the day.
During Market Hours
I focus on monitoring alert levels for potential setups, watching volume patterns around key levels, tracking institutional flow indicators, and most importantly, staying patient for high-probability opportunities rather than forcing trades.
End-of-Day Analysis
After markets close, I review the day’s liquidity grab events to see what worked and what didn’t. I update my liquidity zone markers based on new price action, plan for tomorrow’s potential setups, and journal any lessons learned to improve my approach.
Liquidity Grab PDF Guide
Before we dive into the future of liquidity grab trading, I want to share something valuable with you. There’s an excellent comprehensive PDF guide that covers liquidity grab patterns with detailed chart examples and case studies. This resource has been incredibly helpful for traders looking to deepen their understanding of these concepts.
The Liquidity Grab PDF includes visual examples that complement everything we’ve discussed here. What I particularly appreciate about this guide is how it breaks down real market scenarios with annotated charts that show exactly where the liquidity grabs occurred and how they played out.
If you’re serious about mastering liquidity grab trading, I highly recommend downloading this PDF. It’s packed with practical examples that will help you recognize these patterns in real-time. The visual nature of the guide makes it perfect for studying chart patterns and understanding the nuances of how smart money operates in different market conditions.
The Future of Liquidity Grab Trading
As more traders learn about these concepts, the patterns may evolve. However, the underlying principles – institutional players needing liquidity and retail traders being predictable – are unlikely to change.
Technological Evolution
Algorithmic trading continues to evolve, potentially creating new grab patterns that we haven’t seen before. AI integration could make institutional moves more efficient and harder to detect. As retail education improves and more traders learn these concepts, institutions may need to adapt their strategies to maintain their edge.
Market Structure Changes
Increased transparency through new may provide more insight into institutional positioning, making some of these patterns more obvious. Decentralized Finance (DeFi) may create entirely new liquidity dynamics that we’re only beginning to understand. Central Bank Digital Currencies (CBDCs) could fundamentally change how liquidity grabs occur in traditional markets.
Conclusion
Liquidity grabs aren’t just theoretical concepts – they’re real market phenomena that affect your trading results every day. Whether you’re getting stopped out by false breakouts or wondering why the market seems to move against you, understanding these patterns can transform your trading approach.
The key isn’t to fight these institutional moves, but to recognize them and position yourself accordingly. Sometimes that means avoiding obvious stop-loss levels, sometimes it means fading the grab, and sometimes it means following smart money’s lead.
Remember, successful trading isn’t about predicting every move – it’s about understanding market dynamics and positioning yourself where you have the best probability of success. Liquidity grabs are just one tool in your trading toolbox, but they’re a powerful one when used correctly.
Start small, practice on demo accounts, and gradually incorporate these concepts into your trading plan. The institutions have been playing this game for decades – it’s time you learned the rules.