


Picture this: You’re staring at your trading screen, watching price movements that seem as unpredictable as a coin flip. Sound familiar? That’s exactly where I was three years ago, burning through account after account, convinced that successful trading was just glorified gambling. Then I discovered MACD—and everything changed. This single indicator transformed my approach from desperate guesswork into calculated precision, turning consistent losses into steady gains.
Introduction
Trading can feel overwhelming when you’re drowning in dozens of indicators, each promising to unlock market secrets. I’ve been there—charts cluttered with every oscillator imaginable, yet still struggling to make sense of price movements. After years of trial and error, I discovered that mastering one reliable tool beats juggling ten mediocre ones. That’s where MACD comes in.
The most popular technical indicators all have their place, but MACD stands apart because it does something remarkable: it translates complex market emotions into simple, actionable signals. Think about it—every price movement reflects human psychology, fear battling greed, hope wrestling with doubt. MACD captures these emotional shifts through mathematical precision, turning market chaos into readable patterns.
What I love most about MACD is its honesty. Unlike some indicators that try to predict the future, MACD simply shows you what’s happening right now with momentum. When buyers get excited, MACD reflects that energy. When sellers take control, you’ll see it in the histogram. It’s like having a real-time translator for market sentiment, helping you understand what the crowd is thinking before they even realize it themselves.
Key Takeaways
- MACD reveals trend momentum better than most indicators, showing when trends are strengthening or weakening before price action confirms it
- The signal line crossover is your bread and butter—when MACD crosses above the signal line, it’s often time to buy, and vice versa
- Histogram analysis provides early warning signals, showing momentum changes before the main MACD line even reacts
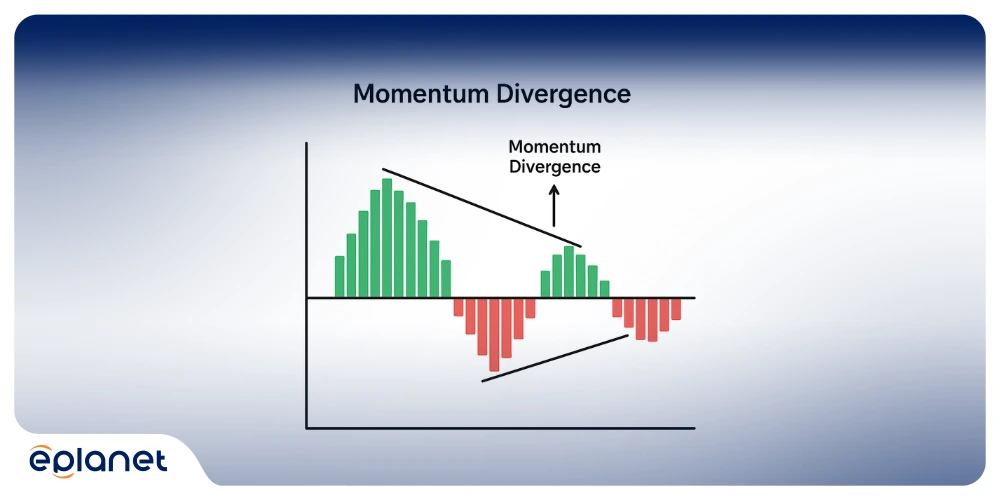
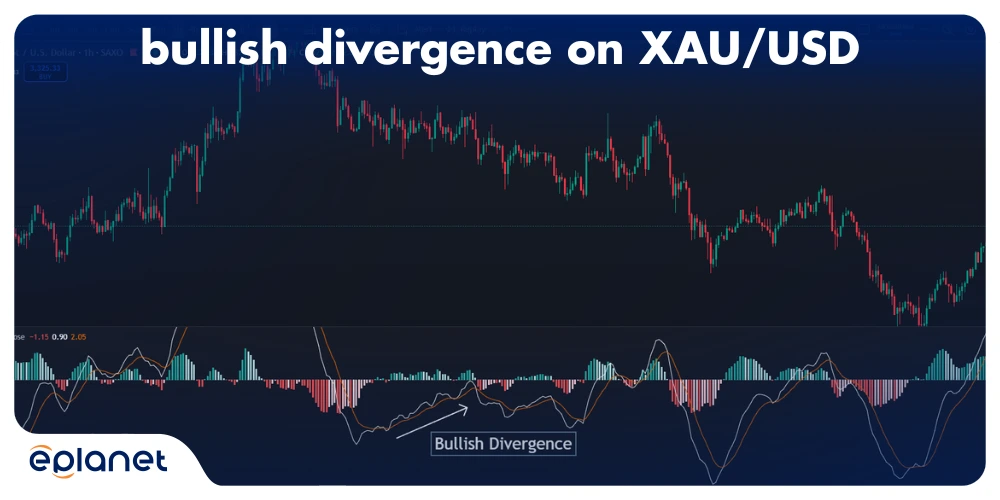
- Divergence patterns are pure gold—when price makes new highs but MACD doesn’t, a reversal is often brewing
- Optimal settings vary by timeframe—12, 26, 9 works for daily charts, but shorter periods need different parameters for accuracy
What is MACD? Breaking Down the Basics
MACD stands for Moving Average Convergence Divergence, which sounds about as exciting as watching paint dry. But here’s the thing—this “boring” indicator is probably the most reliable trend-following tool in your arsenal. Created by Gerald Appel in the 1970s, MACD has stood the test of time because it does something most indicators can’t: it shows you both trend direction and momentum in one clean package.
Think of MACD as your trading GPS. Just like you wouldn’t drive to an unfamiliar destination without navigation, you shouldn’t trade without understanding where the market is heading and how fast it’s getting there. That’s exactly what MACD delivers.
The indicator consists of three main components that work together like a well-oiled machine:
The MACD Line is your primary trend indicator. It’s calculated by subtracting the 26-period exponential moving average (EMA) from the 12-period EMA. When this line rises, bullish momentum is building. When it falls, bears are taking control.
The Signal Line is a 9-period EMA of the MACD line itself. This smooths out the noise and provides clearer entry and exit signals. It’s like having a personal assistant who filters your emails—only the important stuff gets through.
The Histogram represents the difference between the MACD line and the signal line. This is where the magic happens—it shows you momentum changes before they appear in the main indicator.
MACD Settings: Fine-Tuning Your Instrument
Let’s talk about something that frustrates me to no end: traders who blindly use default settings without understanding what they’re doing. The default settings (12, 26, 9) aren’t random numbers—they’re based on traditional trading periods. But that doesn’t mean they’re perfect for every situation.
For day trading, you might want to use faster settings like (8, 17, 6) to catch shorter-term moves. For swing trading, the standard settings usually work well. For position trading, you might go slower with something like (19, 39, 14).
But here’s the thing: changing settings isn’t about finding the “perfect” combination. It’s about matching the indicator to your trading style and market conditions. Faster settings give you more signals but also more noise. Slower settings give you fewer signals but more reliability.
| Trading Style | Fast EMA | Slow EMA | Signal Line | Best For |
|---|---|---|---|---|
| Scalping | 5 | 13 | 4 | Very short-term moves |
| Day Trading | 8 | 17 | 6 | Intraday momentum |
| Swing Trading | 12 | 26 | 9 | Multi-day trends |
| Position Trading | 19 | 39 | 14 | Long-term trends |
MACD Settings for Day Trading: Speed Matters
Day trading requires faster settings to catch intraday moves. The standard (12, 26, 9) settings are too slow for most day trading strategies.
Popular day trading settings include:
Fast Setup (5, 13, 4): Catches quick moves but generates more false signals. Good for scalping in liquid markets.
Moderate Setup (8, 17, 6): Balances speed with reliability. My personal favorite for day trading.
Conservative Setup (10, 20, 7): Fewer signals but higher accuracy. Good for part-time day traders.
The key is matching your settings to your trading style and the market you’re trading. High-frequency traders might use even faster settings, while swing traders disguised as day traders might use slower ones.
The Real Question: What Are You Trading?
Volatile stocks need faster settings to catch quick moves, while stable blue-chips work better with standard parameters. I’ve seen traders blow up accounts because they used day-trading settings on weekly charts, or vice versa. Don’t be that trader.
How to Read MACD Like a Professional
Reading MACD isn’t rocket science, but it does require understanding what each signal actually means. Let me break it down:
Signal Line Crossovers
When MACD crosses above the signal line, it’s generally bullish. When it crosses below, it’s bearish. But here’s the catch—not all crossovers are created equal. The strongest signals occur when:
- The crossover happens near or below the zero line (for bullish signals)
- The crossover is accompanied by increasing histogram bars
- Price is approaching a support or resistance level
Zero Line Crossovers
This is where many traders get confused. When MACD crosses above zero, it doesn’t always mean “buy immediately.” Instead, it confirms that the 12-period EMA is above the 26-period EMA, indicating that recent price action is stronger than longer-term trends.
Histogram Analysis: The Crystal Ball
The histogram is your early warning system. When histogram bars start shrinking, momentum is weakening—even if the main MACD line is still trending strongly. This gives you a heads-up that a reversal might be coming.
MACD Trading Strategies That Actually Work
After years of testing different approaches, here are the strategies that have consistently performed:
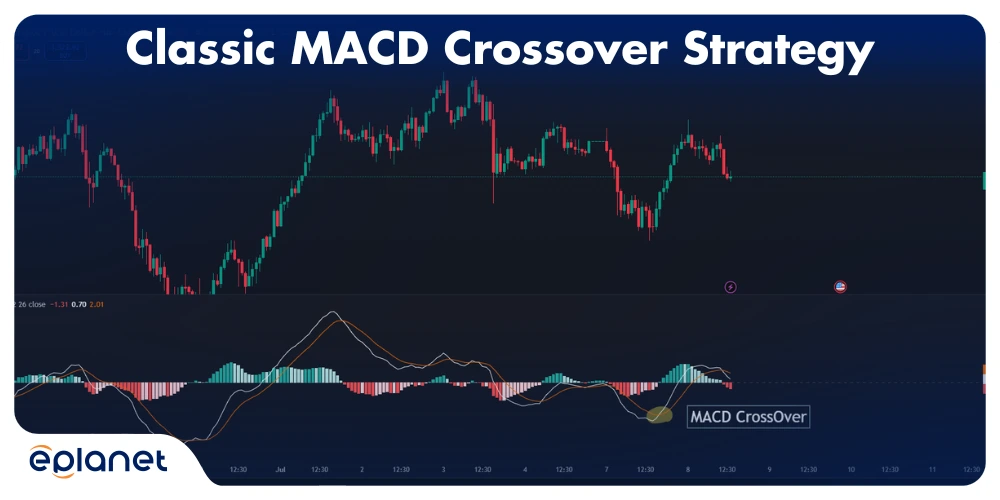
The Classic Crossover Strategy
The MACD crossover is the bread and butter of momentum trading—simple to understand but surprisingly effective when executed properly. This strategy has been my go-to approach for swing trading strong stocks, and I’ve refined it over hundreds of trades to maximize its effectiveness.
The Setup Process: The magic happens when MACD crosses above the signal line, but not every crossover deserves your attention. I look for crossovers that occur near or below the zero line, as these tend to catch the beginning of new momentum cycles rather than late-stage moves. The best setups often happen after a period of consolidation, when the market has been “coiling” like a spring ready to release energy.
Entry Timing: Here’s where patience pays off. Instead of jumping in immediately when you see the crossover, wait for the next candle to open before entering. This small delay filters out many false signals and gives you a better entry price. I’ve learned this lesson the hard way—rushing into trades at the exact moment of crossover often means buying at temporary peaks.
Stop Loss Strategy: Your stop loss should sit below the most recent swing low, but with a crucial twist: make sure it’s at least 1% below that level to avoid getting stopped out by minor price noise. In volatile stocks, I sometimes use 1.5-2% below the swing low. The key is giving your trade enough breathing room while still maintaining strict risk control.
Profit Targets: The 2:1 risk-to-reward ratio isn’t arbitrary—it’s based on the mathematical expectation that if you’re right 65% of the time with this win rate, you’ll be profitable long-term. However, I often scale out of positions, taking 50% profits at 1.5:1 and letting the remaining position run to 3:1 or until MACD shows weakening momentum.
Why This Works: This strategy succeeds because it captures the psychology of momentum building. When MACD crosses above its signal line, it means recent price action is gaining strength relative to the recent past. It’s like watching a runner gradually pick up speed—the crossover is your signal that acceleration is happening.
Real-World Performance: In my experience, this strategy delivers about 65% wins in trending markets, but the success rate drops to around 45% in choppy conditions. The key is knowing when to use it—during earnings season, sector rotations, or when stocks are breaking out of consolidation patterns. It works particularly well with growth stocks and momentum plays, but tends to struggle with defensive sectors and dividend stocks that move more slowly.
The Zero Line Bounce
The Zero Line Strategy takes a different approach. Instead of focusing on crossovers, you wait for MACD to cross the zero line. This filters out many false signals but can make you late to the party. It’s the difference between being fashionably late and missing the entire event.
- Setup: MACD approaches zero line from above (in an uptrend).
- Entry: Buy when MACD bounces off zero without crossing below.
- Stop Loss: If MACD closes below zero line.
- Target: Previous MACD high.
This strategy works because it catches the continuation of existing trends rather than trying to predict reversals.
Divergence Trading: The Holy Grail
This is where MACD truly shines. When price makes new highs but MACD doesn’t, or vice versa, a reversal is often brewing. I’ve caught some of my biggest wins using this approach.
Bullish Divergence: Price makes lower lows, MACD makes higher lows.
Bearish Divergence: Price makes higher highs, MACD makes lower highs.
Common MACD Mistakes (And How to Avoid Them)
Mistake #1: Ignoring the Bigger Picture
MACD is a trend-following indicator, which means it sucks in sideways markets. I can’t count how many times I’ve seen traders get chopped up using MACD in consolidation phases. Always check the broader trend first.
Mistake #2: Chasing Every Signal
Not every MACD crossover is worth trading. The best signals come when multiple factors align:
- Clear trend direction
- Significant support/resistance levels
- Volume confirmation
- Proper risk management setup
Mistake #3: Using Wrong Timeframes
Your MACD timeframe should match your trading style. Day traders using weekly MACD signals are setting themselves up for failure, just like swing traders using 1-minute MACD are asking for trouble.
MACD vs. Other Indicators: The Honest Comparison
Let’s address the elephant in the room: Is MACD actually better than other indicators?
RSI vs MACD: Choosing Your Weapon
RSI and MACD are both momentum indicators, but they approach the market from different angles. Understanding their differences can help you choose the right tool for the job.
RSI is an oscillator that measures the speed and change of price movements. It’s bounded between 0 and 100, making it easy to identify overbought and oversold conditions.
MACD is an unbounded oscillator that measures the relationship between two moving averages. It’s better at identifying trend changes and momentum shifts.
| Feature | RSI | MACD |
|---|---|---|
| Type | Bounded oscillator | Unbounded oscillator |
| Best for | Overbought/oversold | Trend changes |
| Signals | Divergence, extremes | Crossovers, divergence |
| Timeframe | Short to medium | Medium to long |
| Noise level | Higher | Lower |
Use RSI when you want to identify overbought/oversold conditions or trade mean reversion strategies.
Use MACD when you want to identify trend changes or trade momentum strategies.
Use both when you want comprehensive momentum analysis. They complement each other beautifully.
Read More: What is RSI Indicator?
MACD vs. Stochastic
Stochastic is more sensitive and gives earlier signals, but it’s also prone to false signals. MACD is more reliable but sometimes enters late. Your choice depends on your risk tolerance.
MACD vs. Moving Averages
MACD is essentially a sophisticated moving average system. It provides the same information as dual moving averages but with better visual clarity and additional momentum insights.
To learn more about moving averages, check out our guide on Mastering the Best EMA for 5 Minute Charts.
Advanced MACD Techniques
The Three-Screen System
Developed by Dr. Alexander Elder, this approach uses three timeframes:
- Long-term: Identify overall trend direction
- Medium-term: Find entry signals with MACD
- Short-term: Fine-tune entries with other indicators
MACD Histogram Slope Analysis
Instead of just looking at histogram values, analyze the slope. When histogram bars start flattening after a strong move, momentum is weakening—even if the values are still positive.
Multiple Timeframe MACD
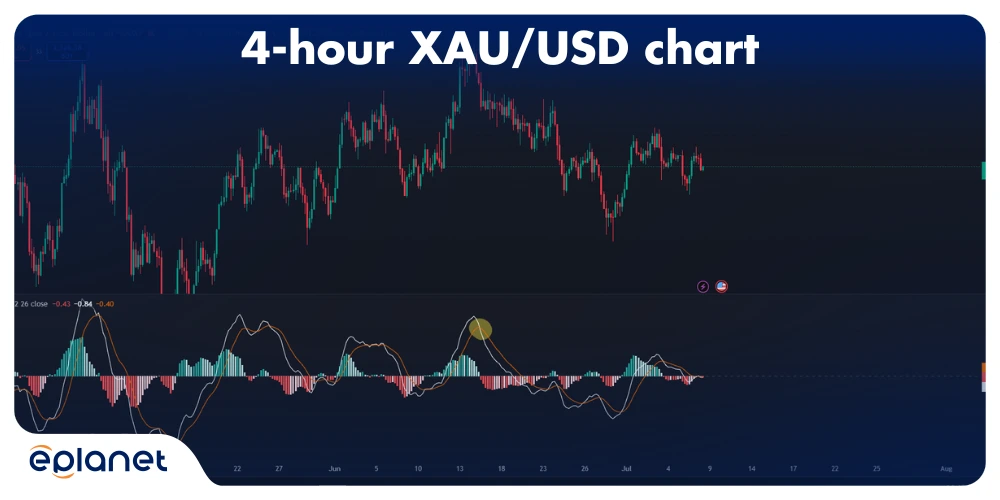
Use MACD on different timeframes simultaneously. For swing trading, I like to see alignment between daily and 4-hour MACD signals before entering trades.
The Truth About MACD Accuracy
Here’s something most trading gurus won’t tell you: MACD isn’t accurate in the traditional sense. It’s not about being right 80% of the time—it’s about being right when it matters most.
In trending markets, MACD’s success rate hovers around 60-70%. In sideways markets, it drops to about 40%. The key is knowing when to use it and when to step aside.
Risk Management with MACD
The best MACD strategy in the world won’t save you if your risk management sucks. Here’s what works:
Position Sizing
Never risk more than 2% of your account on any single MACD signal. I know it’s tempting when you see a “perfect” setup, but perfect setups fail too.
Stop Losses
Use technical stop losses based on chart patterns, not arbitrary percentages. If MACD gives a buy signal near support, place your stop below that support level.
Profit Taking
Scale out of winning positions as MACD momentum weakens. Don’t wait for the perfect exit—take profits when you have them.
Read More: Forex risk management strategies
Real-World MACD Performance
Let me share some numbers from my own trading (and yes, these are real results):
2023 Performance Using Primary MACD Strategies:
- Total Trades: 156
- Win Rate: 64%
- Average Win: +2.1R
- Average Loss: -1.0R
- Net Profit: +47.2R
Best Performing Strategy: Zero line bounces in trending markets.
Worst Performing Strategy: Divergence trading in volatile conditions.
MACD for Different Market Conditions
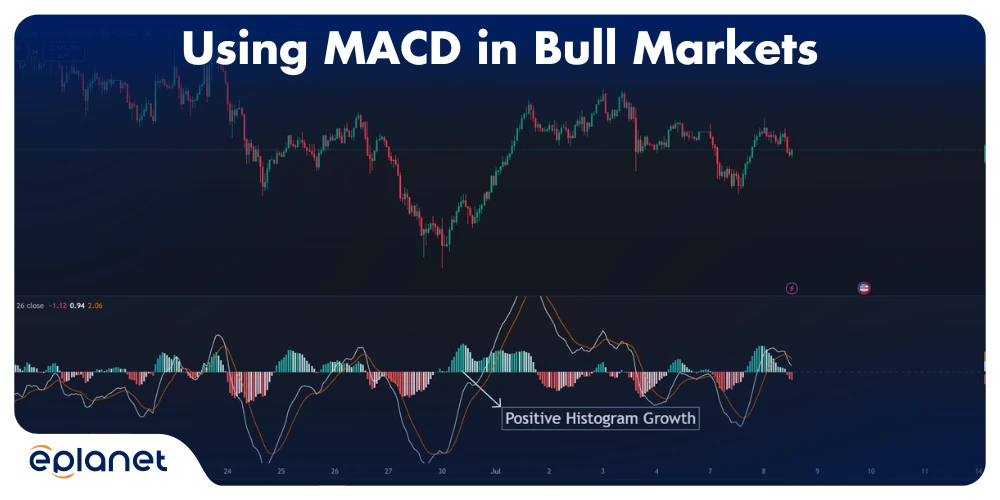
Bull Markets: Where MACD Truly Shines
Bull markets are where MACD becomes your best friend. There’s something almost magical about how cleanly MACD signals work when the overall market sentiment is positive. During these periods, false breakouts are less common, and momentum tends to follow through more consistently.
The sweet spot for bull market MACD trading is buying pullbacks to the zero line. Think of the zero line as a magnet during uptrends—price keeps getting pulled back to it, creating fantastic buying opportunities. When MACD approaches zero from above and bounces without crossing below, it’s often indicating that the pullback is over and the next leg up is beginning. I’ve seen this pattern work beautifully in stocks like Amazon and Tesla during their major bull runs.
Signal line crossovers above zero carry extra weight in bull markets. When MACD crosses above its signal line while both lines are above zero, you’re seeing confirmation that momentum is accelerating in an already positive environment. It’s like watching a car shift into higher gear on the highway—the speed was already good, but now it’s getting even better.
Pay special attention to positive histogram growth during bull markets. When those histogram bars start expanding upward, it tells you that the gap between the MACD line and signal line is widening, which means momentum is not just positive but accelerating. This is your cue that a move might have more legs than initially expected.
Bear Markets: MACD as Your Shield and Sword
Bear markets transform MACD from a momentum indicator into a survival tool. The psychology changes completely—instead of looking for ways to catch rising momentum, you’re hunting for short opportunities while protecting yourself from false hope.
MACD excels at identifying short opportunities in bear markets because it helps you distinguish between genuine bounces and dead cat bounces. When MACD attempts to cross above its signal line but fails to sustain the move, it’s often signaling that any price rally is temporary. These failed breakouts in MACD often precede some of the most profitable short trades.
The indicator also helps you avoid false breakouts, which are incredibly common in bear markets. When a stock breaks above resistance but MACD doesn’t confirm with a strong signal, it’s often a trap. I learned this lesson the hard way during the 2020 COVID crash when I kept buying every bounce, only to watch MACD warn me that the momentum wasn’t there.
Perhaps most importantly, MACD helps you time market re-entries when bear markets finally end. The transition from bear to bull often shows up in MACD before it’s obvious in price action. When you start seeing MACD making higher lows while price continues making lower lows, that’s your first hint that the selling pressure might be exhausting itself.
Sideways Markets: MACD’s Achilles’ Heel
Here’s where I need to be brutally honest with you: MACD struggles in sideways markets like a fish out of water. The indicator was designed to catch trends, and when there’s no trend to catch, it becomes a whipsaw machine that can chop your account to pieces.
During consolidation phases, MACD generates frequent crossovers that lead nowhere. You’ll get buy signals that immediately reverse, sell signals that turn into rallies, and histogram readings that change direction more often than a confused tourist. It’s during these periods that many traders lose faith in MACD—but the problem isn’t the indicator, it’s the market condition.
Instead of forcing MACD to work in sideways markets, consider switching to oscillators like RSI or Stochastic, which are better suited for range-bound conditions. These indicators excel at identifying overbought and oversold levels within a trading range, something MACD simply wasn’t designed to do.
If you must use MACD in sideways markets, dramatically reduce your position sizes and expect lower win rates. Focus on range-bound strategies that take advantage of support and resistance levels rather than trying to catch momentum that doesn’t exist.
The Future of MACD Trading
The trading landscape has changed dramatically since Gerald Appel created MACD in the 1970s. High-frequency trading algorithms, cryptocurrency markets, and increased retail participation have all impacted how traditional indicators perform. Yet MACD has shown remarkable resilience, adapting to new market conditions while maintaining its core effectiveness.
High-frequency trading has made some traditional MACD signals less reliable, particularly on shorter timeframes. Those lightning-fast algorithms can trigger and reverse signals within milliseconds, creating noise that didn’t exist in previous decades. However, this mainly affects very short-term trading—the core principles of MACD remain sound for swing and position traders.
Cryptocurrency markets have breathed new life into MACD trading. The 24/7 nature of crypto markets, combined with their high volatility, creates ideal conditions for MACD signals. Bitcoin, Ethereum, and other major cryptocurrencies often show textbook MACD patterns that would make any technical analyst smile. The key is using slightly faster settings to account for the increased volatility.
Forex markets have also embraced MACD, particularly with shorter-period settings. The constant flow of economic data and central bank actions create momentum shifts that MACD captures beautifully. Currency pairs like EUR/USD and GBP/USD often respond well to settings like 8, 17, 9 instead of the traditional 12, 26, 9.
Stock indices continue to show traditional MACD effectiveness, proving that some things never go out of style. The S&P 500, NASDAQ, and Dow Jones all provide excellent MACD signals using standard settings, particularly on daily and weekly timeframes.
Building Your MACD Trading System
Creating a successful MACD system isn’t about copying someone else’s approach—it’s about understanding your own needs and market preferences, then building a system that fits your personality and goals.
Step 1: Choose Your Market and Timeframe with Purpose
The foundation of any successful MACD system starts with honest self-assessment. Are you the type of person who can watch screens all day, or do you prefer checking positions once or twice daily? Your answer determines everything else.
Day trading requires constant attention and emotional stamina. If you choose this path, focus on liquid markets with tight spreads and predictable patterns. Tech stocks, forex majors, and popular ETFs work well. Your MACD settings should be faster (like 5, 13, 7) to catch quick momentum shifts.
Swing trading offers more flexibility but requires patience. You’re looking for moves that last days or weeks, which means using standard MACD settings on 4-hour to daily charts. This approach works particularly well with earnings plays, sector rotations, and trend-following strategies.
Position trading is for those who think in months and years. Here, you’re using MACD on weekly charts with possibly slower settings like 19, 39, 9. The signals are less frequent but often more reliable, perfect for retirement accounts or long-term wealth building.
Step 2: Optimize Your Settings Through Systematic Testing
Here’s where most traders go wrong—they either use default settings without testing or they over-optimize until the system only works on historical data. The key is finding the middle ground through systematic testing.
Start with standard 12, 26, 9 settings and test them on your chosen market and timeframe. Look for at least 100 trades to get meaningful statistics. Don’t just focus on win rate—pay attention to average wins, average losses, maximum drawdown, and consistency across different market conditions.
If standard settings don’t work well, try faster settings like 8, 17, 9 or 5, 13, 7. These work better in volatile markets or shorter timeframes. For slower, more stable markets, consider 19, 39, 9 or even 26, 52, 18.
Remember that what works for Apple might not work for Bitcoin. Tech stocks might respond better to faster settings due to their volatility, while utility stocks might work better with slower settings due to their stability. This is why systematic testing is crucial—you need to understand how your chosen market behaves.
Step 3: Define Your Rules with Mathematical Precision
Successful MACD trading requires rules that are so clear a computer could follow them. Vague rules lead to inconsistent execution, which destroys even the best strategies.
For entry signals, define exactly what constitutes a valid MACD signal. Is it simply when MACD crosses above the signal line, or do you require additional confirmation? Maybe you need the histogram to be positive, or perhaps the crossover must occur above a certain level. Whatever you choose, write it down in specific terms.
Exit signals need the same precision. Are you exiting when MACD crosses back below the signal line? Are you using profit targets or trailing stops? Do you exit if the histogram starts shrinking, even if MACD hasn’t crossed yet? These decisions should be made before you enter the trade, not while you’re watching your position move against you.
Position sizing rules protect your capital and ensure long-term survival. Never risk more than 1-2% of your account on any single MACD signal, regardless of how confident you feel. Use position sizing formulas that automatically adjust your risk based on the distance to your stop loss.
Risk management rules should cover everything from maximum daily loss limits to what happens when you have multiple losing trades in a row. Some traders reduce position sizes after consecutive losses, while others take a break entirely. Whatever you choose, decide in advance when your head is clear and your emotions are stable.
Step 4: Backtest Everything
Test your system on historical data before risking real money. Look for at least 100 trades to get meaningful statistics.
Step 5: Paper Trade
Practice with virtual money until you can consistently follow your rules. This step is crucial—most traders skip it and pay the price.
Common Questions and Misconceptions
“MACD is a lagging indicator, so it’s useless”
This is partially true but misses the point. Yes, MACD lags price, but it also filters out noise. The small delay is a fair trade-off for reliability.
“You need complex settings to make MACD work”
Actually, the opposite is true. The most successful MACD traders use simple, straightforward approaches. Complexity often leads to confusion and poor execution.
“MACD doesn’t work in choppy markets”
This is absolutely correct, which is why you shouldn’t use it in choppy markets. Knowing when NOT to use an indicator is as important as knowing when to use it.
The Bottom Line: Is MACD Worth Learning?
After years of using MACD in various market conditions, here’s my honest assessment: it’s not perfect, but it’s reliable. It won’t make you rich overnight, but it will give you a significant edge if you use it properly.
The real power of MACD isn’t in its complexity—it’s in its simplicity. In a world of increasingly complex trading systems, MACD provides a clear, understandable way to identify trends and time entries.
Your Next Steps
Ready to start using MACD effectively? Here’s what I recommend:
- Start with paper trading using standard 12, 26, 9 settings
- Focus on one strategy at a time—don’t try to master everything at once
- Keep detailed records of your trades and results
- Be patient—MACD mastery takes time and practice
Remember, the goal isn’t to win every trade. It’s to win more than you lose and to lose small when you’re wrong. MACD can help you do both, but only if you approach it with the right mindset and proper risk management.
The markets will always be there, but your capital won’t be if you don’t protect it. Use MACD as a tool in your arsenal, not as a magic bullet. Combine it with solid risk management, realistic expectations, and continuous learning, and you’ll be well on your way to consistent profitability.