

Think of Break of Structure as the moment when the market shows its hand—revealing whether bulls or bears are truly in control. It’s that decisive instant when price action breaks free from its previous pattern, signaling a potential shift in market sentiment. For traders seeking consistent profits, understanding BOS isn’t just helpful—it’s absolutely essential for reading market psychology and timing entries with surgical precision.
Key Takeaways
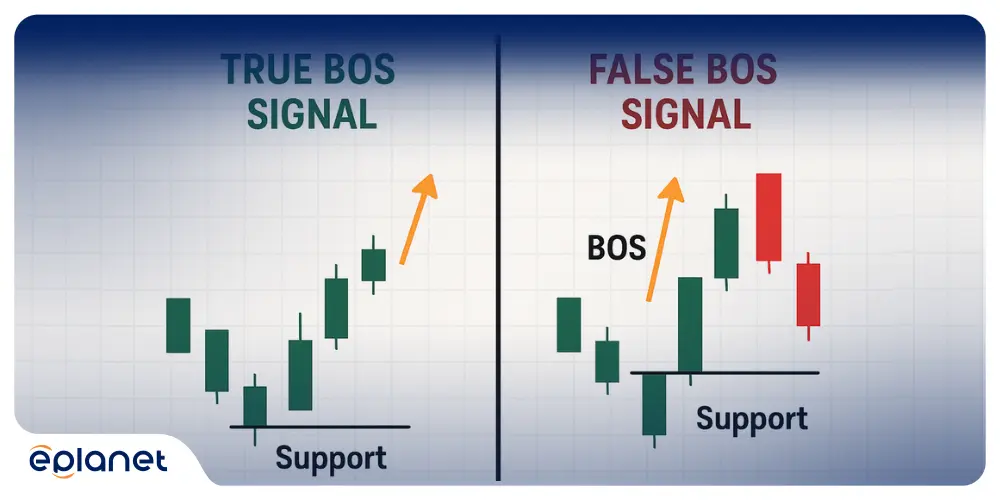
- Pattern Recognition Mastery: Learn to spot genuine break of structure signals versus false breakouts that trap amateur traders.
- Strategic Entry Timing: Discover the optimal timeframes and confirmation techniques that separate profitable trades from costly mistakes.
- Risk Management Excellence: Master position sizing and stop-loss placement strategies specifically designed for BOS trading scenarios.
- Market Psychology Insights: Understand the crowd behavior and institutional movements that create these powerful trading opportunities.
- Real-World Application: Implement proven strategies with concrete examples from actual market conditions and professional trading scenarios.
What is a Break of Structure?
Picture this: you’re watching a boxing match where one fighter has been consistently landing jabs, maintaining control of the ring. Suddenly, their opponent breaks through their guard and lands a devastating hook. That breakthrough moment? That’s essentially what a Break of Structure represents in trading.
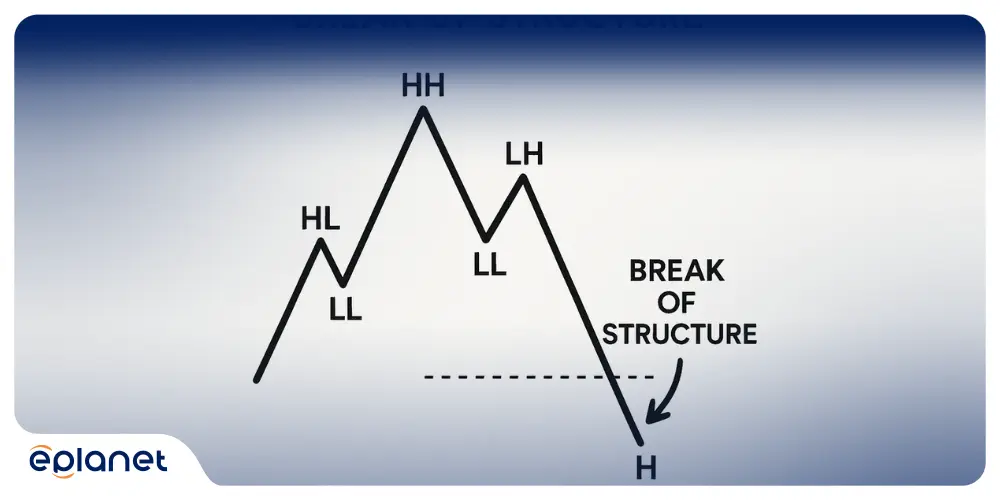
In the financial markets, structure refers to the established pattern of higher highs and higher lows (in an uptrend) or lower highs and lower lows (in a downtrend). When price action decisively breaks this pattern, it signals a potential shift in market sentiment—what we call a Break of Structure or BOS. This concept is fundamental to understanding smart money trading strategies and how institutional players position themselves in the market.
I’ve witnessed countless traders overlook this fundamental concept, only to find themselves on the wrong side of major market moves. The beauty of BOS lies not just in its simplicity, but in its reliability when properly identified and traded.
The Anatomy of Market Structure
Before diving deeper, let’s establish what constitutes market structure. Think of it as the market’s DNA—the recurring patterns that reveal the underlying sentiment of buyers and sellers.
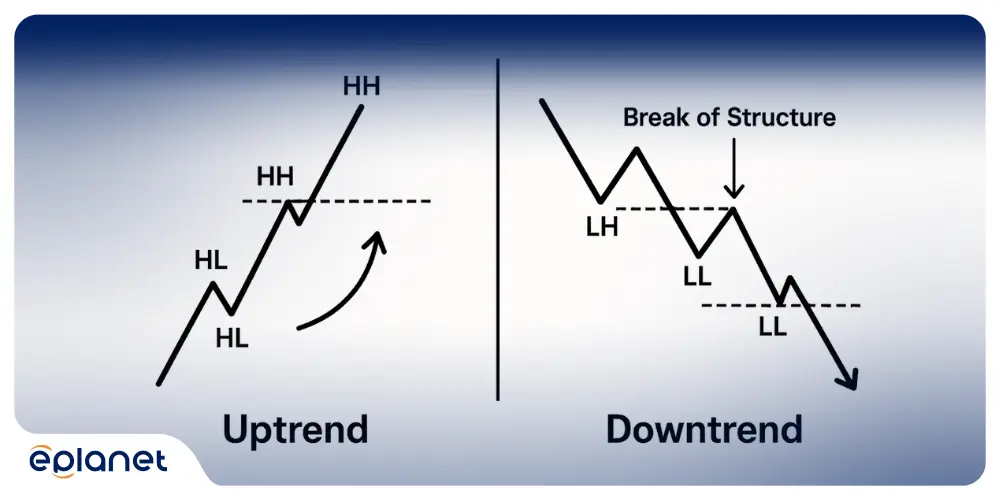
Uptrend Structure:
- Series of higher highs (HH)
- Series of higher lows (HL)
- Consistent buying pressure at support levels
Downtrend Structure:
- Series of lower highs (LH)
- Series of lower lows (LL)
- Consistent selling pressure at resistance levels
When these patterns break, smart money is often repositioning, and retail traders who recognize this shift early can capitalize on the momentum.
How Does Break of Structure Work?
Understanding how BOS works is like learning to read the market’s emotional state. Every candlestick tells a story, and every break reveals the plot twist that changes everything.
The Three-Phase BOS Process
Phase 1: Structure Formation The market establishes a clear pattern of highs and lows. This isn’t random—it’s the result of institutional players, retail sentiment, and fundamental factors creating a temporary equilibrium. During this phase, traders become comfortable with the established trend.
Phase 2: The Break This is where the magic happens. Price decisively breaks through a significant high or low, often accompanied by increased volume. It’s the market’s way of saying, “The old rules no longer apply.”
Phase 3: Confirmation and Follow-Through The true test of any BOS isn’t the initial break—it’s what happens next. Does price continue in the new direction, or does it quickly reverse back into the previous structure? This phase separates genuine breaks from false signals.
Volume: The Silent Validator
Here’s something most trading courses won’t tell you: volume is the secret sauce that confirms whether a BOS is legitimate. A break on heavy volume suggests institutional involvement, while a break on weak volume might indicate a false signal.
I remember analyzing a EUR/USD break that looked textbook perfect on the price chart. However, the volume analysis revealed it was merely retail FOMO (fear of missing out) rather than genuine institutional flow. That break failed within hours, trapping late buyers.
The Crucial Importance of Break of Structure in Trading
Let me share a story that perfectly illustrates why BOS matters. In 2019, I was tracking Bitcoin during one of its major bull runs. The cryptocurrency had been making consistent higher highs for weeks, and retail sentiment was euphoric. Everyone was calling for $20,000.
Then it happened—a decisive break below a major swing low, creating a clear BOS to the downside. While social media was still buzzing about moon missions, this structural break signaled the party was over. Bitcoin dropped nearly 50% over the following months.
Why BOS Trumps Traditional Indicators
Traditional indicators like RSI, MACD, and moving averages are reactive—they tell you what already happened. Break of Structure is proactive—it shows you what’s likely to happen next.
| Traditional Indicators | Break of Structure |
|---|---|
| Lagging signals | Leading signals |
| Based on mathematical formulas | Based on actual price action |
| Can give false signals in ranging markets | Most effective during trend transitions |
| Require multiple confirmations | Self-confirming when properly identified |
The Psychology Behind the Pattern
Understanding BOS means understanding human psychology. When structure breaks, it triggers emotional responses:
- Fear: Traders holding positions against the new trend panic
- Greed: New traders rush to join the breakout
- Uncertainty: Sidelined traders struggle to interpret the signal
Smart traders exploit these emotions by positioning themselves ahead of the crowd.

Best Timeframes for Break of Structure Trading: Finding Your Sweet Spot
Choosing the right timeframe for BOS trading isn’t just about preference—it’s about matching your strategy to your lifestyle and risk tolerance. Let me break down the pros and cons of each approach based on years of trading experience.
Higher Timeframes: The Institutional Approach (Daily, 4-Hour)
Daily Charts: The Strategic Advantage
Trading BOS on daily charts is like playing chess while others play checkers. You’re seeing the bigger picture, making decisions based on institutional-level information rather than market noise.
Advantages:
- Higher probability setups
- Less false signals
- Aligns with institutional trading
- Perfect for busy professionals
- Lower stress levels
Disadvantages:
- Fewer trade opportunities
- Larger stop losses required
- Slower gratification
4-Hour Charts: The Balanced Approach
This timeframe offers the perfect balance between opportunity and reliability. It’s my personal favorite for BOS trading because it filters out much of the daily noise while still providing sufficient trading opportunities.
Lower Timeframes: The Active Trader’s Playground (1-Hour, 15-Minute)
1-Hour Charts: The Sweet Spot for Active Traders
If you can dedicate time to monitor the markets during key sessions, 1-hour BOS setups offer an excellent risk-to-reward ratio.
15-minute Charts: High-Frequency BOS
This is where scalpers thrive, but it requires significant screen time and emotional discipline. The signals come fast, and so do the losses if you’re not careful.
My Recommended Timeframe Strategy
Here’s what I’ve learned works best: Use multiple timeframes in harmony. Identify the overall trend on the daily chart, look for BOS setups on the 4-hour, and fine-tune your entries on the 1-hour chart.
How to Identify Break of Structure
Identifying genuine BOS requires more than just looking for broken lines on a chart. It’s about understanding market context, volume patterns, and the subtle clues that separate professional-grade signals from amateur traps.
The Five-Step BOS Identification Process
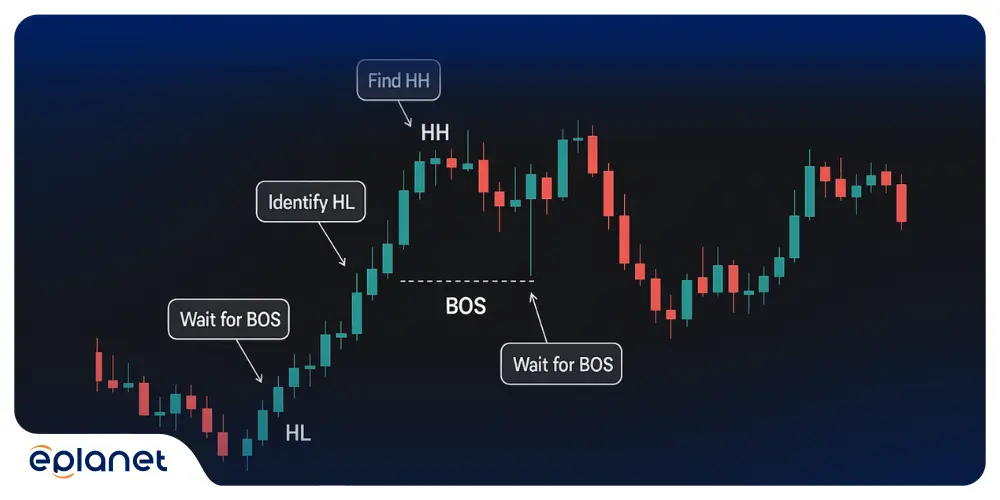
Step 1: Map the Current Structure Start by identifying the most recent swing highs and lows. Draw your levels clearly—this becomes your roadmap for potential breaks.
Step 2: Wait for the Break Patience is crucial here. A genuine break should be decisive, not a marginal push beyond the level. I typically look for at least a 10-pip break in forex markets before considering it significant.
Step 3: Volume Analysis Check if the break coincides with increased volume. This is especially important in stock trading, though forex volume data can be less reliable due to the decentralized nature of the market.
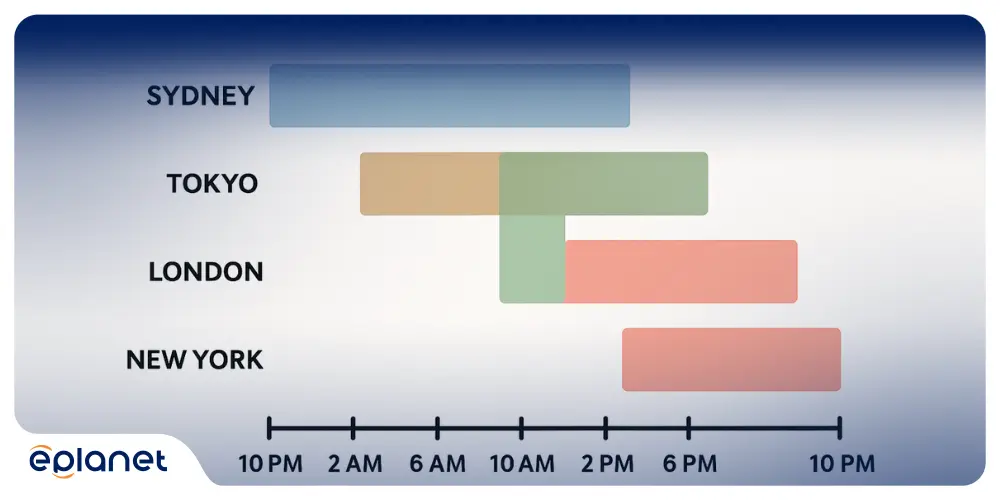
Step 4: Time Context Consider when the break occurs. Breaks during major market sessions (London, New York) carry more weight than those during quiet Asian hours.
Step 5: Confirmation Setup Never trade the initial break. Wait for a retest of the broken level and look for rejection signals that confirm the new structure.
Common BOS Identification Mistakes
Mistake #1: Trading Every Break Not every structural break is worth trading. Context matters. A break during low liquidity or major news events might be temporary.
Mistake #2: Ignoring the Bigger Picture A break on the 15-minute chart means little if the daily trend remains intact. Always consider higher timeframe context.
Mistake #3: Premature Entry The most expensive lesson in BOS trading? Entering before confirmation. I’ve seen traders nail the direction but lose money due to poor timing.
Advanced Identification Techniques
The False Break Filter Before any trade, I ask: “Could this be a liquidity hunt?” Often, smart money will briefly push price beyond key levels to trigger stops before reversing. Look for rapid reversal back into the structure as a warning sign.
Read More: Liquidity Grab vs Stop Hunting
The Confluence Factor The best BOS setups occur at significant technical levels: major support/resistance, round numbers, or Fibonacci retracements. These confluences increase the probability of follow-through.
Break of Structure Examples
Let me walk you through some actual market examples that showcase both successful BOS trades and costly mistakes. These aren’t theoretical—they’re drawn from real trading scenarios I’ve either executed or closely analyzed.
Case Study 1: EUR/USD Daily BOS Success (March 2023)
The Setup: EUR/USD had been in a clear downtrend for months, making consistent lower highs and lower lows. The pair was approaching a major support level around 1.0500—a level that had held multiple times historically.
The Break: On March 15th, price decisively broke above the previous swing high at 1.0850, creating a clear BOS to the upside. The break occurred during London session with strong volume confirmation.
The Trade:
- Entry: 1.0865 (after pullback and rejection)
- Stop Loss: 1.0820 (below the broken structure)
- Target: 1.1150 (next major resistance)
- Result: +285 pips profit over 3 weeks
Key Lessons: This trade worked because it aligned with changing fundamentals (ECB hawkish stance) and showed proper technical confirmation.
Case Study 2: Bitcoin BOS False Signal (August 2022)
The Setup: Bitcoin had been consolidating around $20,000 for weeks, forming a clear range-bound structure. Traders were watching for a decisive break either way.
The False Break: On August 18th, BTC briefly spiked above $22,500, breaking the range resistance. Social media exploded with bullish calls, and retail traders piled in.
The Reversal: Within 6 hours, Bitcoin was back below $21,000, and by the end of the week, it had fallen to $19,500.
What Went Wrong:
- Break occurred during low volume weekend trading
- No fundamental catalyst to support the move
- Immediate rejection back into the range structure
Key Lessons: Context is everything. Weekend breaks in crypto often lack follow-through due to low institutional participation.
Case Study 3: Apple Stock BOS Before Earnings (October 2023)
The Setup: Apple had been in a sideways consolidation pattern between $165-$180 for two months leading up to quarterly earnings.
The Break: Three days before earnings, AAPL broke below $165 on heavy volume, creating a clear BOS to the downside.
The Follow-Through: Despite beating earnings expectations, the stock continued lower, reaching $155 within two weeks.
Analysis: This example shows how structural breaks often precede fundamental news. Smart money was positioning ahead of retail traders who were focused solely on earnings numbers.
Best Strategies for Trading Break of Structure in Forex
Forex markets offer unique advantages for BOS trading due to their high liquidity and 24-hour nature. However, they also present specific challenges that require adapted strategies.
Strategy 1: The London Breakout Method
This is my bread-and-butter strategy for trading BOS in forex markets.
Setup Requirements:
- Clear structure established during Asian session
- Break must occur within first 2 hours of London open
- Minimum 15-pip break from structure level
- Volume confirmation (if available)
Entry Process:
- Mark Asian session highs/lows
- Wait for London session break
- Enter on first pullback to broken level
- Stop loss 10 pips beyond structure
- Target next major S/R level
Risk Management:
- Never risk more than 1% per trade
- Trail stops once price moves 20 pips in favor
- Close half position at 1:2 R/R, let remainder run
Strategy 2: The New York Reversal Play
New York session often brings institutional flows that can reverse Asian and European trends.
Timing: First hour of NY session (8-9 AM EST).
Best Pairs: Major USD pairs (EUR/USD, GBP/USD, USD/JPY).
Setup: Look for BOS that contradicts earlier session direction.
Strategy 3: The Weekly Structure Strategy
For swing traders who prefer less screen time:
Timeframe: Weekly charts for structure, daily for entry.
Holding Period: Several weeks to months.
Best Pairs: Major pairs with strong trending tendencies.
| Strategy | Timeframe | Win Rate | R/R Ratio | Trades/Month |
|---|---|---|---|---|
| London Breakout | 1H-4H | 65% | 1:2 | 8-12 |
| NY Reversal | 4H-Daily | 70% | 1:3 | 4-6 |
| Weekly Structure | Weekly-Daily | 55% | 1:4 | 2-3 |
Advanced Forex BOS Techniques
Currency Correlation Analysis Before trading any BOS setup, check correlated pairs. If EUR/USD breaks structure but EUR/GBP doesn’t, the break might be USD-specific rather than EUR weakness.
Central Bank Timing Avoid trading BOS setups immediately before major central bank announcements. The artificial volatility can invalidate technical signals.
Session Overlap Strategy The most reliable BOS signals often occur during session overlaps (London/NY overlap is particularly potent) when maximum liquidity is present.
Break of Structure Forex PDF
To accelerate your BOS mastery, I’ve compiled the most valuable educational resources that have shaped my own trading journey. Below, you’ll discover essential study materials, recommended books, and even access to a comprehensive PDF guide that breaks down BOS strategies in detail.
Recommended Study Materials
“Smart Money Concepts” This comprehensive guide covers BOS within the broader context of institutional trading strategies. The PDF format makes it perfect for offline study and note-taking.
“Price Action Mastery Series” A multi-part educational series that dedicates significant coverage to structural analysis and break patterns. Particularly strong on real-world examples.
Trading Platform Guides Most major platforms (MetaTrader 4/5, TradingView, cTrader) offer specific guides on identifying and trading structure breaks. These often include:
- Template setups for automatic level drawing
- Alert systems for structural breaks
- Backtesting frameworks for strategy validation
Creating Your Own BOS Study Guide
Rather than relying solely on external resources, I recommend creating your own BOS reference document:
Section 1: Personal Rules
- Your specific criteria for identifying valid breaks
- Timeframes you’ll trade
- Risk management parameters
Section 2: Market Examples
- Screenshots of successful BOS trades
- Analysis of failed setups and lessons learned
- Notes on market-specific behaviors
Section 3: Performance Tracking
- Trade logs with entry/exit analysis
- Monthly performance reviews
- Strategy refinement notes
For comprehensive BOS education and detailed examples, I recommend checking out Download this professional trading resource (PDF) which offers in-depth coverage of structural analysis techniques.
Top Books on Break of Structure Trading
While BOS is often covered within broader price action education, several exceptional books provide the theoretical foundation and practical application you need.
Essential Reading List
“Technical Analysis of the Financial Markets” by John Murphy Though not exclusively about BOS, this classic text provides the foundational understanding of market structure that every serious trader needs. Murphy’s chapter on trend analysis is particularly relevant to structural concepts.
“Trading Price Action Trends” by Al Brooks Brooks offers one of the most detailed examinations of how price structure evolves in real-time. His methodology for identifying trend changes aligns perfectly with BOS principles.
“Reminiscences of a Stock Operator” by Edwin Lefèvre While written decades ago, this semi-biographical novel of Jesse Livermore contains timeless insights about market structure and the psychology behind major trend changes.
“Market Wizards” by Jack Schwager Several of the featured traders discuss their approaches to identifying structural changes in markets. Pay particular attention to interviews with trend-following traders.
Modern BOS-Focused Publications
“Smart Money Concepts: A Practical Guide” This newer publication specifically addresses institutional trading concepts, including detailed BOS analysis and application.
“The Structure of Market Psychology” Combines behavioral finance with technical analysis, offering unique insights into why structural breaks occur and how to position ahead of them.
Building Your Trading Library Strategy
I recommend this reading sequence:
- Start with Murphy for foundational knowledge
- Progress to Brooks for detailed price action understanding
- Study Livermore for psychological insights
- Use modern publications for current market application
Pro Tip: Don’t just read—actively take notes and create your own interpretation of each concept. The best traders adapt published strategies to their own trading personality and market conditions.
Break of Structure and Change of Character
Understanding the relationship between Break of Structure (BOS) and Change of Character (CHoCH) is like learning to read the market’s mood swings. These concepts work together to provide a complete picture of market sentiment shifts.
Defining Change of Character
While BOS represents a decisive break of established structure, Change of Character refers to subtle shifts in market behavior that often precede major structural breaks. Think of CHoCH as the early warning system—the tremor before the earthquake.
Key CHoCH Indicators:
- Decreased momentum in the prevailing trend
- Inability to make new extremes despite multiple attempts
- Increased volatility around key levels
- Divergence between price and volume
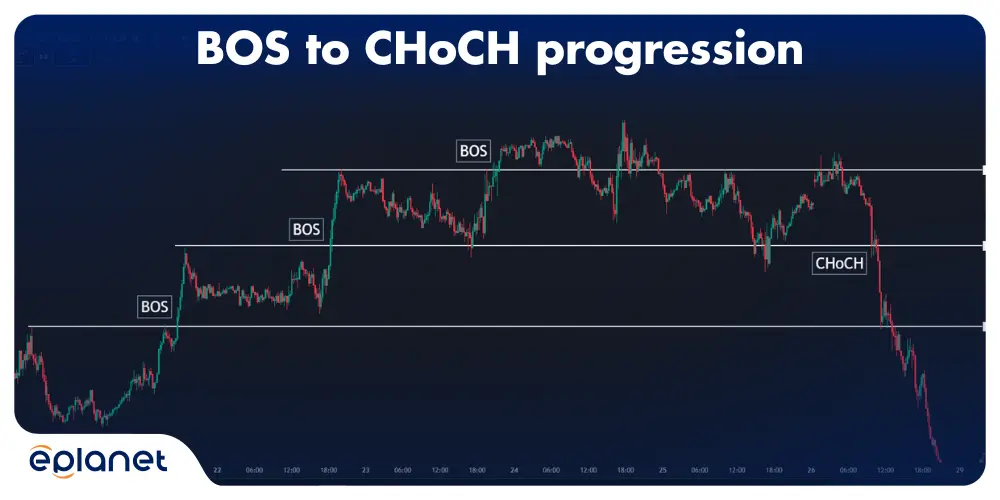
The BOS-CHoCH Sequence
Phase 1: Normal Market Behavior Price moves within established structure with predictable patterns and reactions at key levels.
Phase 2: Change of Character Emerges Subtle signs appear: weaker bounces, shorter rallies, increased consolidation time. The market is “thinking” about changing direction.
Phase 3: Break of Structure Occurs The formal break happens, confirming what CHoCH was suggesting. This is where most traders finally notice the shift.
Phase 4: New Structure Establishment The market begins forming new patterns based on the changed sentiment.
Practical Application: Trading the Sequence
Early Entry Strategy (CHoCH-based):
- Higher risk, higher reward
- Requires excellent market timing
- Best for experienced traders
- Entry before the crowd
Confirmation Strategy (BOS-based):
- Lower risk, moderate reward
- Waits for clear confirmation
- Suitable for all skill levels
- Entry with institutional flow
Real-World Example: EUR/USD Shift Analysis
In late 2022, EUR/USD showed classic CHoCH signals around the 1.0350 level:
- Multiple failed attempts to break below parity
- Shortened selling waves
- Increased buying interest at key levels
Traders who recognized these CHoCH signals could position for the eventual BOS that occurred in January 2023, leading to a 400+ pip rally.
| Signal Type | Entry Timing | Risk Level | Potential Reward | Skill Required |
|---|---|---|---|---|
| CHoCH | Early | High | Very High | Expert |
| BOS | Confirmation | Moderate | High | Intermediate |
| Combined | Staged | Managed | Optimized | Advanced |
Frequently Asked Questions
What is the difference between a break of structure and a false breakout?
This is the million-dollar question that separates profitable traders from those who struggle. A genuine break of structure shows sustained movement beyond the broken level, often accompanied by increased volume and follow-through over multiple sessions. False breakouts typically reverse quickly back into the original structure, often within the same trading session.
Key Differences:
- Volume: Genuine breaks show expanding volume; false breaks often show declining volume
- Time: Real breaks hold for multiple sessions; false ones reverse quickly
- Context: Authentic breaks align with broader market sentiment; false ones often contradict it
- Follow-through: True breaks create new swing points; false ones fail to sustain momentum
My rule of thumb: If price can’t hold the break for at least 4 hours on the timeframe you’re trading, treat it with extreme caution.
How long should I wait for confirmation after a break of structure?
Patience is your greatest asset in BOS trading. I typically wait for at least one complete retest of the broken level before entering. This usually takes:
- 15-minute charts: 1-4 hours
- 1-hour charts: 4-12 hours
- 4-hour charts: 1-3 days
- Daily charts: 3-7 days
The key is allowing the market to prove the break is legitimate through price action, not rushing into trades based on excitement.
Can break of structure work in ranging markets?
Absolutely, but with important caveats. In ranging markets, BOS signals often indicate breakouts from consolidation rather than trend changes. The principles remain the same, but the application differs:
Range BOS Characteristics:
- Less reliable than trending market breaks
- Require tighter risk management
- Often result in shorter-term moves
- Need stronger volume confirmation
Success Strategy: In ranging markets, focus on BOS at major range boundaries rather than minor internal structure breaks.
What’s the best stop-loss strategy for BOS trades?
Your stop-loss placement should reflect the market structure you’re trading. Here’s my hierarchy of stop-loss methods:
Method 1: Structure-Based Stops (Preferred) Place stops beyond the invalidation point of your BOS signal. If trading an upside break, place stops below the broken high that’s now support.
Method 2: ATR-Based Stops Use Average True Range to account for normal market volatility. Typically 1.5-2x ATR beyond your entry point.
Method 3: Fixed Pip Stops Least preferred, but sometimes necessary for position sizing. Should still respect structural levels.
Never: Use arbitrary round numbers or percentage-based stops that ignore market structure.
How do I avoid getting trapped in false BOS signals?
False signals are part of trading, but you can minimize their impact:
Pre-Trade Analysis:
- Check multiple timeframes for confirmation
- Verify volume support (where available)
- Consider fundamental backdrop
- Assess market session timing
During the Trade:
- Monitor for immediate reversal signs
- Be ready to exit if break fails to hold
- Don’t add to losing positions hoping for recovery
Risk Management:
- Never risk more than you can afford to lose
- Use position sizing that accounts for potential false signals
- Keep detailed records to identify patterns in your false signal frequency
Remember: Even professional traders experience false signals. The key is managing them effectively, not avoiding them entirely.
Conclusion
Break of Structure isn’t just another trading concept—it’s a fundamental shift in how you view market behavior. Throughout our journey together, we’ve explored everything from basic identification to advanced trading strategies, real-world examples to psychological insights.
The markets will always reward those who can read structural changes before the crowd catches on. Whether you’re analyzing the London breakout, waiting for New York reversals, or positioning for weekly structural shifts, the principles remain consistent: patience, confirmation, and disciplined execution.
Remember my Bitcoin story from earlier? The traders who recognized that structural break saved themselves months of losses. The EUR/USD case study showed how proper BOS identification can yield hundreds of pips. These aren’t lucky breaks—they’re the result of systematic analysis and disciplined application of the concepts we’ve covered.