


Picture this: you’re staring at a stock chart that looks like abstract art, and somewhere in that chaotic mess of lines and colors lies your next profitable trade. Enter Bollinger Bands – the technical indicator that’s been quietly making traders money since 1983. These aren’t just random lines on your screen; they’re your roadmap to understanding market volatility, timing entries, and spotting opportunities that others miss completely.
Key Takeaways
- Bollinger Bands consist of three lines: a middle moving average and two outer bands that expand and contract based on market volatility.
- The squeeze phenomenon: When bands tighten together, it often signals an explosive price movement is coming.
- Mean reversion principle: Prices tend to return to the middle band (moving average) after touching the outer bands.
- Volatility indicator: Wide bands signal high volatility periods, while narrow bands indicate low volatility.
- Multiple timeframe analysis: Combining different timeframes enhances the reliability of Bollinger Band signals.
What Are Bollinger Bands?
Think of Bollinger Bands as the market’s mood ring. Just as a mood ring changes colors based on temperature, Bollinger Bands expand and contract based on market volatility. Created by John Bollinger in the early 1980s, one of the most popular technical indicators has become as essential to traders as a good cup of coffee is to a morning routine.
The beauty lies in their simplicity. You’ve got three lines working in harmony:
The middle band is typically a 20-period simple moving average – your baseline, your center of gravity. It’s where prices want to hang out when they’re not being dramatic.
The upper and lower bands are usually set two standard deviations away from that middle line. These bands breathe with the market, expanding when things get crazy and contracting when traders are taking a nap.
I remember when I first discovered Bollinger Bands. I was that guy squinting at charts at 2 AM, trying to decode the market’s secret language. Then someone showed me these bands, and suddenly it was like having subtitles for a foreign film – everything started making sense.

The Math Behind Bollinger Bands (Don’t Worry, It’s Not That Scary)
Here’s where some people’s eyes glaze over, but stick with me. The math is actually your friend here, and understanding it gives you a massive edge.
The standard formula uses:
- Period: Usually 20 (but you can adjust this)
- Standard Deviation: Typically 2 (again, adjustable)
- Moving Average: Simple moving average of the closing prices
| Component | Standard Setting | Purpose |
|---|---|---|
| Middle Band | 20-period SMA | Trend direction and mean reversion level |
| Upper Band | SMA + (2 × Standard Deviation) | Resistance and overbought signals |
| Lower Band | SMA – (2 × Standard Deviation) | Support and oversold signals |
The standard deviation part is what makes these bands special. It measures how spread out the prices are from the average. When prices are all over the place (high volatility), the bands widen. When prices are playing nice and staying close to the average (low volatility), the bands tighten up.
How to Use Bollinger Bands Effectively
The Bollinger Band Squeeze: Your Crystal Ball Moment
This is where things get interesting. When the bands squeeze together like an accordion, it’s the market’s way of saying, “Something big is about to happen.” The tighter the squeeze, the bigger the potential explosion.
I’ve seen traders make their entire month’s profit from a single squeeze breakout. It’s that powerful.
How to spot it:
- Upper and lower bands are closer together than they’ve been in at least 6 periods
- Volume often decreases during the squeeze
- Price action becomes range-bound and boring
What to do:
- Set alerts for breakouts above the upper band or below the lower band
- Prepare for increased volatility
- Have your risk management plan ready
The Bollinger Bounce Strategy
This one’s built on the idea that prices are like rubber balls – they tend to bounce off the bands and head back toward the middle. It works best in ranging markets where there’s no strong trend.
The setup:
- Price touches or penetrates the upper band (potential sell signal)
- Price touches or penetrates the lower band (potential buy signal)
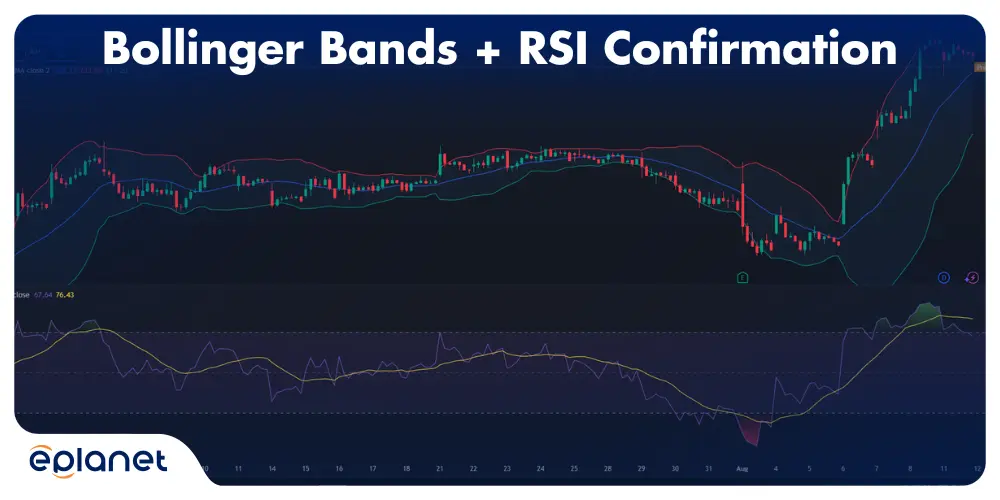
- Look for confirmation with other indicators like RSI or MACD
Walking the Bands (Trend Following)
Sometimes prices don’t bounce – they walk along the upper or lower band like they’re on a tightrope. This usually happens in strong trending markets.
Upper band walk: Strong uptrend, prices consistently stay near or above the upper band.
Lower band walk: Strong downtrend, prices consistently stay near or below the lower band.
What Should Bollinger Bands Be Set At?
The million-dollar question. The standard setting (20, 2) works for most situations, but let me share some insider knowledge that most retail traders don’t know.
Standard Settings Breakdown
| Timeframe | Period | Standard Deviation | Best For |
|---|---|---|---|
| Day Trading | 20 | 2.0 | Quick scalps and intraday moves |
| Swing Trading | 20 | 2.0 | Multi-day to weekly positions |
| Position Trading | 50 | 2.5 | Long-term trends and major reversals |
| Scalping | 10 | 1.5 | Ultra-short term entries |
Custom Settings for Different Markets
Volatile markets (like crypto): Try 20, 2.5 or even 20, 3.0 to avoid false signals.
Stable markets (like blue-chip stocks): 20, 1.5 might give you more sensitive signals.
Trending markets: Consider using 50, 2 for stronger trend confirmation.
I learned this the hard way when I first started trading crypto with standard Bollinger Band settings. Got whipsawed more times than I care to admit. Once I adjusted for higher volatility, my win rate improved dramatically.
The Rule for Bollinger Bands
If I had to give you one rule to live by with Bollinger Bands, it would be this:
Never trade against the overall trend based solely on a Bollinger Band signal.
This simple rule will save you from more losses than any other piece of advice. Bollinger Bands are excellent for timing entries and exits within the context of the major trend, but they’re poor at predicting major trend reversals on their own.
How Reliable Are Bollinger Bands?
The reliability question is like asking how reliable a car is – it depends on how you drive it and maintain it.
High reliability scenarios:
- Bollinger Band squeeze followed by volume expansion
- Multiple timeframe confirmation
- Combined with momentum indicators
- Used in appropriate market conditions
Lower reliability scenarios:
- Used alone without confirmation
- Applied in choppy, news-driven markets
- Ignoring the overall trend context
Research suggests that Bollinger Bands have roughly 65-70% accuracy when used correctly with proper risk management. That might not sound impressive, but in trading, that’s actually quite good – especially when you consider that you can control your risk-reward ratio.
The Secret of Bollinger Bands (That Nobody Talks About)
Here’s what the textbooks won’t tell you: the real power of Bollinger Bands isn’t in the signals they generate – it’s in helping you understand market psychology.
When bands are wide, traders are emotional – either greedy or fearful. When bands are narrow, traders are complacent. The transitions between these states are where the money is made.
The four market states:
- Expansion: Volatility increasing, strong moves beginning
- Trending: Sustained directional movement
- Contraction: Volatility decreasing, consolidation phase
- Squeeze: Extremely low volatility, breakout imminent
Understanding which state you’re in helps you choose the right strategy. It’s like having a weather forecast for the markets.
Bollinger Bands vs Other Indicators
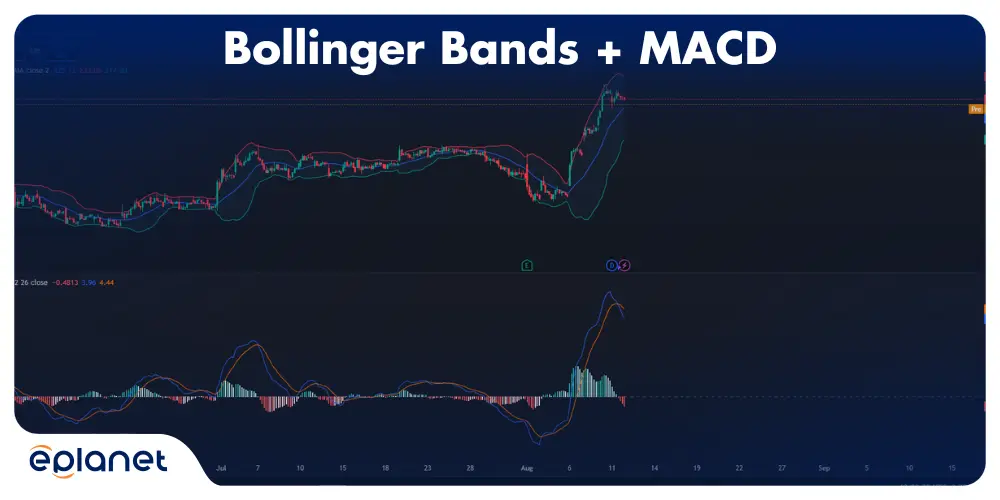
Bollinger Bands vs MACD
MACD is great for momentum and trend changes, but it’s a lagging indicator. Bollinger Bands give you real-time volatility information and can spot potential reversal points before MACD even twitches.
When to use MACD: Confirming Bollinger Band signals, especially trend changes.
When to use Bollinger Bands: Volatility analysis, support/resistance levels, squeeze setups.
Read More: What is MACD?
Bollinger Bands vs RSI
RSI measures overbought/oversold conditions but doesn’t adapt to changing market volatility. Bollinger Bands automatically adjust their “overbought” and “oversold” levels based on recent price action.
The combo: Use RSI divergences to confirm Bollinger Band reversal signals. When price hits the upper band and RSI shows bearish divergence, that’s a high-probability short setup.
Read More: What is RSI Indicator?
Bollinger Bands vs VWAP
VWAP (Volume Weighted Average Price) is institutional traders’ favorite, but it resets daily and doesn’t show volatility. Bollinger Bands provide continuous support/resistance levels that don’t disappear at market close.
Pro tip: Use VWAP as your overall bias (long above, short below) and Bollinger Bands for precise entry and exit timing.
Which Indicator Is Best for Trading?
Here’s the truth bomb: there’s no single “best” indicator. But Bollinger Bands are definitely in the hall of fame for good reasons.
What makes Bollinger Bands special:
- They adapt to market conditions automatically
- They provide multiple types of signals (trend, volatility, reversal)
- They work across different timeframes and markets
- They’re visual and intuitive
But they’re not perfect. In strongly trending markets, the bounce strategy can be a disaster. In sideways markets, trend-following signals can lead you astray.
Advanced Bollinger Band Strategies
The Double Bollinger Strategy
This is where things get sophisticated. Instead of using just one set of Bollinger Bands, you layer two sets with different parameters:
Inner bands: 20, 1 Outer bands: 20, 2
The space between creates four zones:
- Extreme bullish (above outer upper band)
- Moderately bullish (between inner and outer upper bands)
- Moderately bearish (between inner and outer lower bands)
- Extreme bearish (below outer lower band)
This setup gives you much more nuanced signals and better risk management opportunities.
The Bollinger Band %B Indicator
This hidden gem shows exactly where the current price sits relative to the bands. It oscillates between 0 and 1:
- %B above 1: Price is above the upper band (very overbought)
- %B between 0.8-1: Price is near the upper band (overbought)
- %B around 0.5: Price is at the middle band (neutral)
- %B between 0-0.2: Price is near the lower band (oversold)
- %B below 0: Price is below the lower band (very oversold)
The Three-Timeframe Approach
This is my personal favorite for swing trading:
Long-term chart (daily): Determines overall trend direction.
Medium-term chart (4-hour): Identifies entry zones.
Short-term chart (1-hour): Precise entry and exit timing.
Only take trades where all three timeframes align. It dramatically improves your win rate.
Common Bollinger Band Mistakes (And How to Avoid Them)
Mistake #1: Assuming Every Touch Is a Reversal
Just because price touches a band doesn’t mean it’s going to reverse. In trending markets, prices can “walk the bands” for extended periods.
Solution: Always consider the overall trend. In uptrends, focus on bounces off the lower band. In downtrends, focus on bounces off the upper band.
Mistake #2: Using Bollinger Bands in Isolation
Bollinger Bands are powerful, but they’re not omniscient. They need confirmation from other indicators or price action signals.
Solution: Develop a systematic approach that includes volume analysis, momentum indicators, and support/resistance levels.
Mistake #3: Wrong Time Frame Selection
Using Bollinger Bands on a 1-minute chart for position trading (or vice versa) is like using a microscope to look at the moon.
Solution: Match your timeframe to your trading style. Day traders should focus on intraday charts, while position traders should use daily or weekly charts.
Mistake #4: Ignoring the Squeeze
Many traders only pay attention to Bollinger Bands when they’re giving signals. The squeeze periods are actually where the biggest opportunities are being set up.
Solution: Set alerts for when bands tighten to historically narrow levels. These periods often precede the biggest moves.
Do Day Traders Use Bollinger Bands?
Absolutely. In fact, many professional day traders consider Bollinger Bands essential. Here’s why they’re particularly useful for intraday trading:
Quick volatility assessment: One glance tells you if the market is sleepy or energetic.
Dynamic support and resistance: Levels that adjust throughout the day.
Breakout identification: Perfect for momentum trading strategies.
Risk management: Clear levels for stop-loss placement.
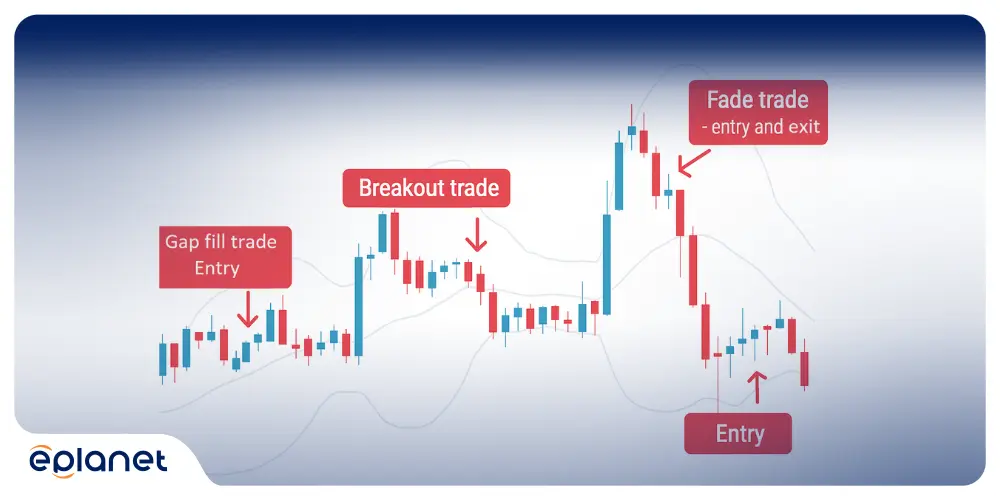
Popular day trading setups:
- Gap fill trades: When a stock gaps up at open, watch for price to return toward the middle band
- Breakout trades: Enter when price breaks through a band with volume
- Fade trades: Counter-trend trades when price hits extreme band levels with divergence
The Best Timeframe for Bollinger Bands
There’s no universal “best” timeframe, but here’s how to choose:
For Day Trading
Primary chart: 5-minute or 15-minute.
Confirmation chart: 1-hour for trend context.
Filter chart: Daily for overall market bias.
For Swing Trading
Primary chart: 1-hour or 4-hour.
Confirmation chart: Daily for trend direction.
Filter chart: Weekly for major support/resistance.
For Position Trading
Primary chart: Daily.
Confirmation chart: Weekly for trend confirmation.
Filter chart: Monthly for major cycle analysis.
Read More: The Importance of Timeframe in Trading
How to Use 2 Bollinger Bands in Trading
The dual Bollinger Band system is a game-changer for serious traders. Here’s how to implement it:
Setup
Fast Bollinger Bands: 10 periods, 1.5 standard deviation.
Slow Bollinger Bands: 20 periods, 2.0 standard deviation.
Trading Signals
Strong buy signal: Price breaks above slow upper band with fast bands expanding.
Moderate buy signal: Price between fast and slow upper bands in uptrend.
Neutral zone: Price between both middle bands.
Moderate sell signal: Price between fast and slow lower bands in downtrend.
Strong sell signal: Price breaks below slow lower band with fast bands expanding.
This system gives you much better signal quality and helps you avoid whipsaws in choppy markets.
Bollinger Band Weaknesses (The Honest Truth)
Every indicator has limitations, and Bollinger Bands are no exception:
Weakness #1: Lagging in Fast Markets
In rapidly moving markets (like during earnings announcements or economic releases), Bollinger Bands can lag behind price action significantly.
Weakness #2: False Signals in Choppy Markets
During periods of high noise and low trend clarity, Bollinger Bands can generate many false signals.
Weakness #3: No Directional Bias
Bollinger Bands tell you about volatility and potential reversal points, but they don’t inherently provide directional bias like moving averages do.
Weakness #4: Parameter Sensitivity
Small changes in the period or standard deviation settings can significantly alter signal generation, making optimization tricky.
Success Rate of Bollinger Bands
Let’s talk numbers. Based on extensive backtesting across different markets and timeframes:
| Strategy Type | Approximate Win Rate | Best Markets | Worst Markets |
|---|---|---|---|
| Band Bounce | 60-65% | Range-bound stocks | Strong trending stocks |
| Band Break | 55-60% | Trending markets | Choppy/sideways markets |
| Squeeze Play | 70-75% | Any market | Very low volume periods |
| Combined Approach | 65-70% | Most conditions | Highly news-driven periods |
Important note: These win rates assume proper risk management, confirmation signals, and appropriate market selection. Your results will vary based on your execution and discipline.
When to Buy and Sell with Bollinger Bands
Buy Signals
Strong buy: Price breaks above upper band with expanding volume in established uptrend.
Moderate buy: Price bounces off lower band with RSI showing oversold conditions.
Cautious buy: Price returns to middle band from below in uptrend.
Sell Signals
Strong sell: Price breaks below lower band with expanding volume in established downtrend.
Moderate sell: Price bounces off upper band with RSI showing overbought conditions.
Cautious sell: Price returns to middle band from above in downtrend.
The Context Rule
Never trade Bollinger Band signals in isolation. Always consider:
- Overall market trend
- Volume patterns
- News/events
- Support and resistance levels
- Other technical indicators
How Accurate Is the Bollinger Bands Indicator?
Accuracy is a loaded question in trading. Here’s the realistic picture:
In trending markets: 55-65% accuracy for reversal signals, 60-70% for continuation signals.
In ranging markets: 65-75% accuracy for bounce signals.
During squeeze setups: 70-80% accuracy for breakout direction (once the breakout occurs).
The key insight? Accuracy matters less than your risk-reward ratio and position sizing. A 60% accurate system with a 2:1 reward-to-risk ratio will make you money consistently.
Best Strategy for Bollinger Bands
After years of trading and testing, here’s my highest-probability Bollinger Band strategy:
The Triple Confirmation Setup
Step 1: Identify market regime (trending vs. ranging) using 50-period moving average.
Step 2: Wait for Bollinger Band squeeze (bands at 20-period low in width).
Step 3: Look for breakout with at least 50% above-average volume.
Step 4: Confirm with momentum indicator (RSI, MACD, or Stochastic).
Step 5: Enter on first pullback to the broken band.
Step 6: Set stop-loss beyond the opposite band.
Step 7: Take profits at 2:1 or 3:1 risk-reward ratio.
This strategy combines the best aspects of volatility analysis, momentum confirmation, and risk management.
Pairing Bollinger Bands with Other Indicators
Bollinger Bands + Volume
Volume is the fuel that powers price movements. When Bollinger Band signals align with volume patterns, the probability of success increases dramatically.
High-probability setups:
- Band breakout with volume 50% above average
- Band bounce with decreasing volume (shows exhaustion)
- Squeeze breakdown with accelerating volume
Bollinger Bands + Moving Averages
Use longer-period moving averages (50, 100, 200) to determine overall trend direction. Only take Bollinger Band signals that align with the major trend.
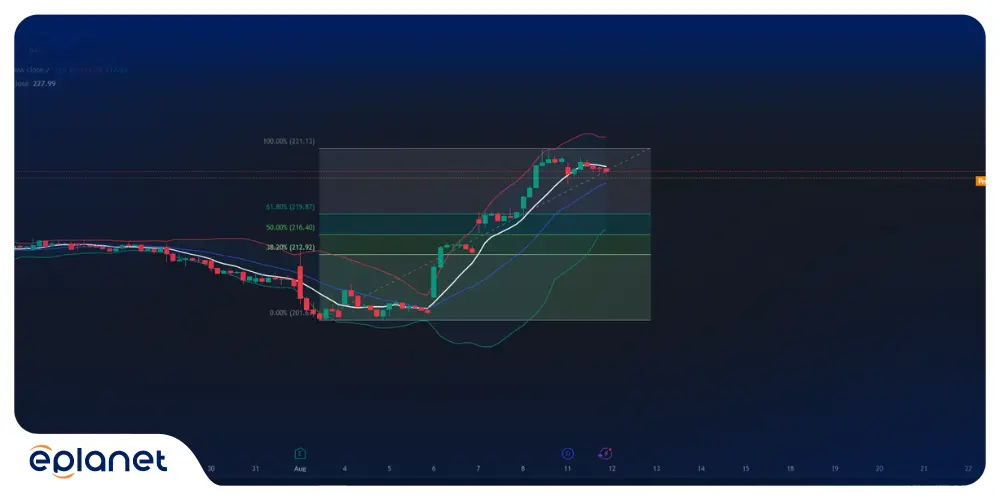
Bollinger Bands + Fibonacci Retracements
When Bollinger Bands align with key Fibonacci levels, you’ve got institutional-grade support and resistance zones.
Reading a Bollinger Band Indicator
Learning to read Bollinger Bands is like learning to read market emotions:
Band Width Analysis
Expanding bands: Market is becoming more volatile, big moves likely.
Contracting bands: Market is becoming less volatile, consolidation phase.
Extremely narrow bands: Volatility explosion imminent.
Price Position Analysis
Price at upper band: Potential resistance, consider profit-taking.
Price at middle band: Equilibrium, neutral zone.
Price at lower band: Potential support, consider buying.
Band Slope Analysis
All bands sloping up: Strong uptrend in progress.
All bands sloping down: Strong downtrend in progress.
Flat bands: Sideways market, range-trading environment.
Three Lines of Bollinger Bands Explained
The three-line system creates a complete picture of market behavior:
Upper Band (Resistance Level)
- Acts as dynamic resistance in uptrends
- Shows overbought conditions in ranging markets
- Breaking above signals strong bullish momentum
Middle Band (Equilibrium Line)
- Shows the average price over the selected period
- Acts as support in uptrends, resistance in downtrends
- Price tends to return here after extreme moves
Lower Band (Support Level)
- Acts as dynamic support in downtrends
- Shows oversold conditions in ranging markets
- Breaking below signals strong bearish momentum
The genius of this system is that these levels automatically adjust to changing market conditions, unlike static support and resistance lines.
Advanced Tips for Bollinger Band Mastery
Tip #1: Watch the Band Angles
When both upper and lower bands are angled in the same direction, it shows strong trending momentum. When they’re angled in opposite directions, expect consolidation.
Tip #2: Use Bollinger Band Width Indicator
This separate indicator shows the width of the bands numerically. Set alerts for 20-period lows in width to catch squeeze setups automatically.
Tip #3: Multiple Standard Deviations
Consider using 1, 2, and 3 standard deviation bands simultaneously. This creates a more nuanced view of support and resistance levels.
Tip #4: Seasonal Adjustments
Some markets have seasonal volatility patterns. Adjust your standard deviation settings accordingly (higher in volatile seasons, lower in quiet periods).
Conclusion
Bollinger Bands aren’t just another technical indicator – they’re a window into market psychology. They show you when traders are confident and when they’re scared, when they’re taking risks and when they’re playing it safe.
The key to success with Bollinger Bands lies not in finding the perfect settings or the ultimate strategy, but in understanding what the bands are telling you about market conditions. Are traders emotional or complacent? Is volatility expanding or contracting? Are we in a trending environment or a ranging one?
Master these concepts, practice with discipline, and always remember that no single indicator – not even Bollinger Bands – should be used in isolation. Combine them with volume analysis, momentum indicators, and sound risk management principles.
Your trading account will thank you for it.